Key PointsQuestion Based on blood donations in the US from July 2020 through May 2021, how did infection- and vaccine-induced SARS-CoV-2 seroprevalence vary over time by demographic group and by geographic region?
Findings In this repeated cross-sectional study that included 1 443 519 blood donation specimens from a catchment area representing 74% of the US population, estimated SARS-CoV-2 seroprevalence weighted for differences between the study sample and general population increased from 3.5% in July 2020 to 20.2% for infection-induced antibodies and 83.3% for combined infection- and vaccine-induced antibodies in May 2021. Seroprevalence differed by age, race and ethnicity, and geographic region of residence, but these differences changed over the course of the study.
Meaning Based on a sample of blood donations in the US from July 2020 through May 2021, estimated SARS-CoV-2 seroprevalence increased over time and varied by age, race and ethnicity, and geographic region.
Importance People who have been infected with or vaccinated against SARS-CoV-2 have reduced risk of subsequent infection, but the proportion of people in the US with SARS-CoV-2 antibodies from infection or vaccination is uncertain.
Objective To estimate trends in SARS-CoV-2 seroprevalence related to infection and vaccination in the US population.
Design, Setting, and Participants In a repeated cross-sectional study conducted each month during July 2020 through May 2021, 17 blood collection organizations with blood donations from all 50 US states; Washington, DC; and Puerto Rico were organized into 66 study-specific regions, representing a catchment of 74% of the US population. For each study region, specimens from a median of approximately 2000 blood donors were selected and tested each month; a total of 1 594 363 specimens were initially selected and tested. The final date of blood donation collection was May 31, 2021.
Exposure Calendar time.
Main Outcomes and Measures Proportion of persons with detectable SARS-CoV-2 spike and nucleocapsid antibodies. Seroprevalence was weighted for demographic differences between the blood donor sample and general population. Infection-induced seroprevalence was defined as the prevalence of the population with both spike and nucleocapsid antibodies. Combined infection- and vaccination-induced seroprevalence was defined as the prevalence of the population with spike antibodies. The seroprevalence estimates were compared with cumulative COVID-19 case report incidence rates.
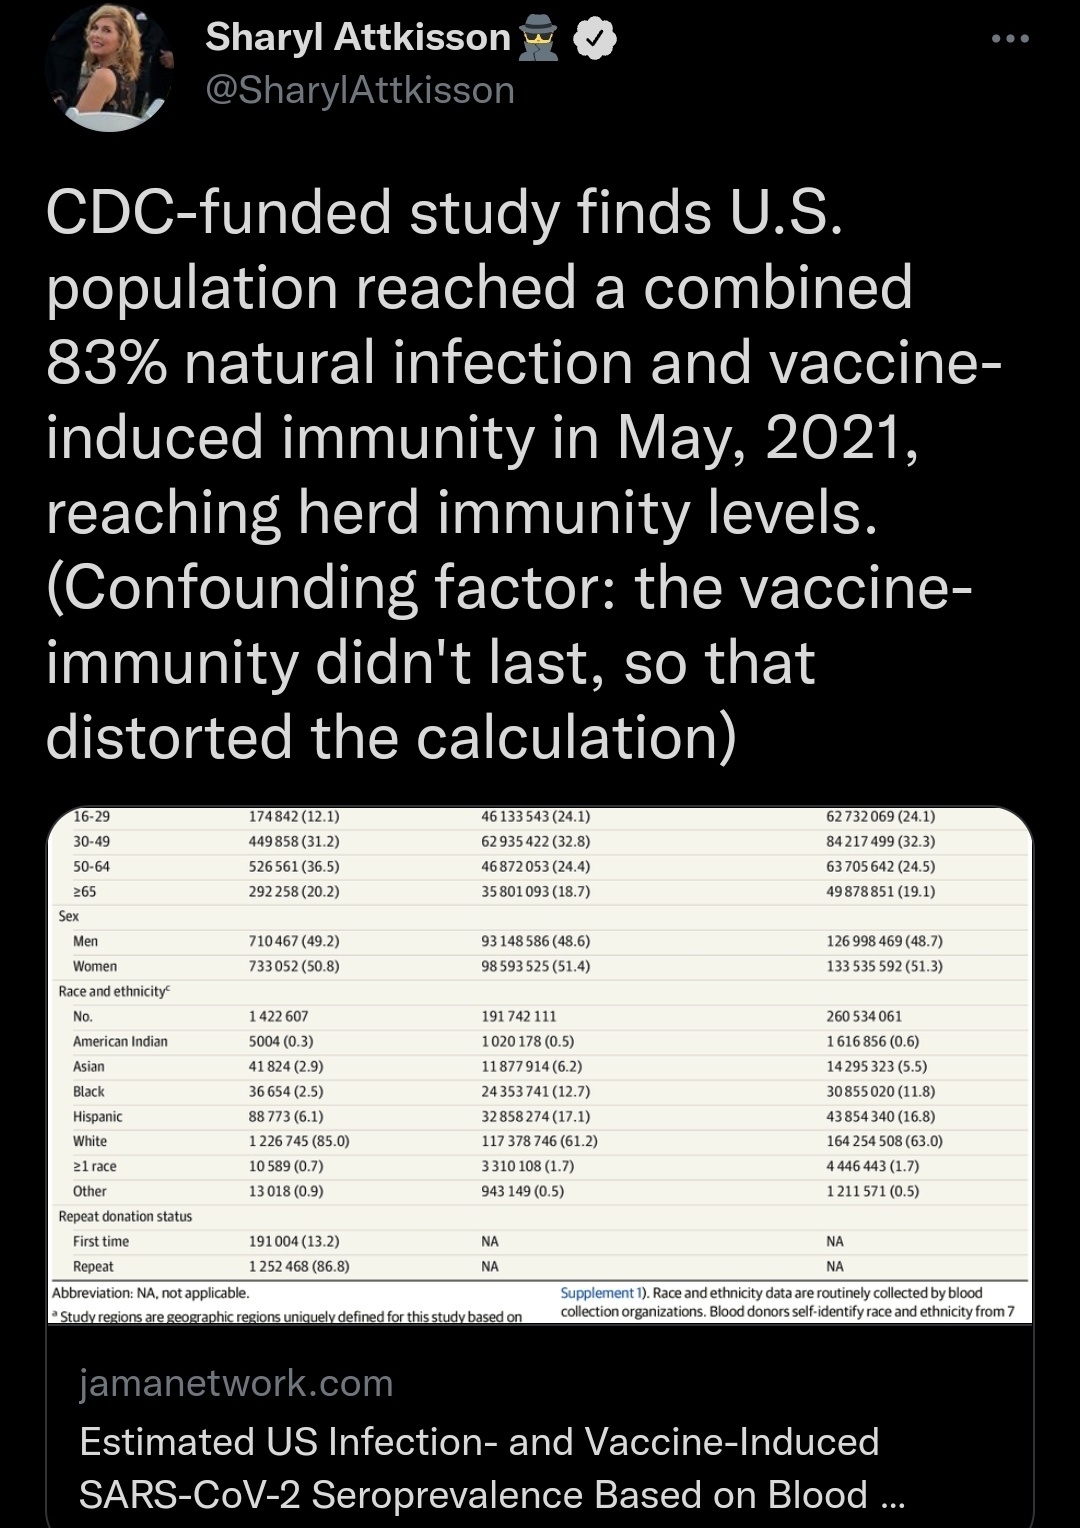
Results Among 1 443 519 specimens included, 733 052 (50.8%) were from women, 174 842 (12.1%) were from persons aged 16 to 29 years, 292 258 (20.2%) were from persons aged 65 years and older, 36 654 (2.5%) were from non-Hispanic Black persons, and 88 773 (6.1%) were from Hispanic persons. The overall infection-induced SARS-CoV-2 seroprevalence estimate increased from 3.5% (95% CI, 3.2%-3.8%) in July 2020 to 20.2% (95% CI, 19.9%-20.6%) in May 2021; the combined infection- and vaccination-induced seroprevalence estimate in May 2021 was 83.3% (95% CI, 82.9%-83.7%). By May 2021, 2.1 SARS-CoV-2 infections (95% CI, 2.0-2.1) per reported COVID-19 case were estimated to have occurred.
Conclusions and Relevance Based on a sample of blood donations in the US from July 2020 through May 2021, vaccine- and infection-induced SARS-CoV-2 seroprevalence increased over time and varied by age, race and ethnicity, and geographic region. Despite weighting to adjust for demographic differences, these findings from a national sample of blood donors may not be representative of the entire US population.
SARS-CoV-2 transmission has been reported in the US since early 2020, with approximately 36.3 million COVID-19 cases reported as of August 13, 2021.1 Routine COVID-19 case reports probably underestimate the total number of infections because persons with mild disease or asymptomatic infection might not be identified or tested.2 Seroprevalence studies can estimate the prevalence of persons with SARS-CoV-2–specific antibodies, which can be due to natural infection or induced by vaccination.3–5
Previous SARS-CoV-2 seroprevalence studies conducted in the US have focused on specific populations (eg, health care personnel) or have been limited in time or geographic region.6 Few studies have been conducted after COVID-19 vaccine administration began or have differentiated infection- and vaccine-induced seroprevalence. Blood donation specimens are useful for serosurveillance because numerous specimens can be efficiently collected and tested.4 Several countries have conducted SARS-CoV-2 seroprevalence studies using blood donation specimens, and US blood collection organizations have reported SARS-CoV-2 seroprevalence among donations.6–8
This study was conducted to estimate SARS-CoV-2 seroprevalence in the general US population aged 16 years and older using blood donation specimens collected from July 2020 through May 2021, adjusting for demographic differences between the blood donor sample and the general population.
This study was approved by institutional review boards of the University of California San Francisco and Westat as non–human participants research based on anonymization of data and routine consent for use of residual blood donation specimens for research purposes. It was reviewed by Centers of Disease Control and Prevention (CDC) and conducted consistent with applicable federal law and CDC policy.9–13
In March 2020, the National Heart, Lung, and Blood Institute Recipient Epidemiology and Donor Evaluation Study-IV-Pediatric (REDS-IV-P) program began a repeated cross-sectional SARS-CoV-2 seroprevalence study called the REDS-IV-P Epidemiology, Surveillance, and Preparedness of the Novel SARS-CoV-2 Epidemic (RESPONSE) study using 6000 monthly blood donation specimens from 6 metropolitan regions over 6 months.14 Beginning in July 2020, the CDC expanded the study using established RESPONSE infrastructure and methodologies. This analysis includes samples of blood donations in the US from July 2020 through May 2021, and the final date of blood donation collection was May 31, 2021.
Sample Selection and Serologic Testing
In July 2020, 10 regional and national blood collection organizations began participation, which increased to 17 by October 2020, providing representation from all 50 US states; Washington, DC; and Puerto Rico (eFigure 1 and eTable 1 in Supplement 1). After excluding COVID-19 convalescent plasma donations, samples of approximately 2000 specimens from allogeneic donors were compiled monthly from blood donor regions in each blood organization’s catchment area using pseudorandom or convenience sampling strategies (eMethods, eTable 2, and eFigure 2 in Supplement 1). From blood donor regions with more blood donors from racial and ethnic minority groups, 4000 specimens were compiled monthly to increase representation. From 2 blood donor regions that included 3 states each, 6000 specimens were compiled monthly to ensure sufficient samples from each state.
To ensure the same geographic areas were represented each month, sampled geographic regions from each blood collection organization were defined by a set of zip codes where more than 90% of blood donors resided. Specimens from donors residing outside those zip codes were excluded (eMethods in Supplement 1). From these aggregated zip codes, 66 study regions were created based on state and metropolitan borders (eFigure 1 and eTable 3 in Supplement 1). Each study region contributed approximately 500 to 4000 specimens monthly.
Specimens were tested for antibodies against the S-1 portion of the spike (S) protein using the VITROS chemiluminescent S1 total Ig assay (Ortho Clinical Diagnostics). Specimens with S antibodies were tested for nucleocapsid (N) antibodies using the chemiluminescent Roche Elecsys Total Ig Assay (Roche Diagnostics). These assays were chosen because they received Emergency Use Authorization from the US Food and Drug Administration (FDA) prior to study initiation, had reported sensitivity of 88.3% to 100% and specificity of 99.1% to 100%, and had demonstrated stable high sensitivity for 6 months or longer after infection.14–17 From July through December 2020, only specimens with borderline positive S antibody results (ie, signal-to-cutoff ratio, 1-10) were tested for N antibodies.14 Based on previous results, all specimens collected during 2020 with S antibody signal-to-cutoff ratio greater than 10 were assumed to have N antibodies.14 Beginning in January 2021, after COVID-19 vaccine administration began, all specimens with S antibodies were tested for N antibodies to differentiate infection- and vaccination-induced seropositivity. Both SARS-CoV-2 infection and COVID-19 vaccines currently authorized under an Emergency Use Authorization or fully FDA approved result in production of S antibodies but only infection results in production of N antibodies.18
Two blood collection organizations asked blood donors if they had received a COVID-19 vaccine prior to donation.
The primary outcomes were the combined infection- and vaccination-induced SARS-CoV-2 seroprevalence (defined as prevalence of specimens with S antibodies and referred to as combined seroprevalence) and infection-induced SARS-CoV-2 seroprevalence (defined as prevalence of specimens with both S and N antibodies) (eMethods and eTable 4 in Supplement 1), with a final date of blood donation collection of May 31, 2021.
Blood collection organizations provided routinely collected, deidentified demographic information for each blood donation, including donor age, sex, race and ethnicity (self-identified from 7 fixed categories), and zip code of residence. Researchers chose to assess race and ethnicity because infection and vaccination rates vary by these characteristics.1,6,8 Donations with missing demographic information were excluded. Because demographics of the blood donor population differ from the US general population,19 seroprevalence estimates were weighted in an effort to ensure that the demographic characteristics of the blood donor sample matched that of the general population (eMethods in Supplement 1). Monthly estimation weights were computed by raking, a statistical calibration technique, using the 2018 American Community Survey 5-year estimates for age, sex, and race and ethnicity compositions for blood donor regions (eMethods in Supplement 1).20 Monthly sets of 50 replicate weights were created to estimate the variance.21 Only weighted seroprevalence estimates are presented.
Combined and infection-induced seroprevalence rates were estimated for each study region, then for each US Census region by combining study regions within a Census region (eTable 3 and eFigure 2 in Supplement 1), and studywide. Seroprevalence was estimated by age, race and ethnicity, and sex. To determine whether the addition of 7 blood organizations after July 2020 affected trends, analyses were also performed after restricting inclusion to organizations that began participation in July 2020.
Comparisons of distributions of seroprevalence estimates across demographic categories were performed using χ2 tests, while pairwise comparisons of seroprevalence estimates were performed using 2-sided t tests. Both tests were performed on the weighted data sets with a significance level of .05, using the replicate weights for inference. Because of the potential for type I error due to multiple comparisons, findings for secondary analyses should be interpreted as exploratory.
Seroprevalence was estimated by study region, which was defined by zip codes, whereas COVID-19 cases are reported by county as part of routine public health surveillance.1 To estimate the number of SARS-CoV-2 infections per case reported, each study region was analyzed using the group of counties located within it. A county was included in a study region if the total population of all study region zip codes that overlapped with that county comprised 30% or more of the county population. To estimate the number of total infections per reported case, infection-induced seroprevalence estimates for each study region were divided by the number of cumulative case reports per 100 population for counties included in each study region. Cumulative COVID-19 case numbers were based on aggregate counts reported by state and territorial jurisdictions to the CDC.1 All analyses were conducted using SAS version 9.4 (SAS Institute).
Overall, 1 443 519 blood donation specimens were included. Because additional blood organizations began participation from August through October 2020, the number of monthly specimens included in the analysis increased from approximately 117 000 in July 2020 to 135 000 from November 2020 through May 2021 (eTable 1 and eTable 5 in Supplement 1), and the proportion of the US population residing in all study regions increased from 69.2% to 73.9%. In total, 150 844 specimens were excluded, including 108 501 (6.8%) because donors resided outside the study regions and 42 343 (2.9% of remaining) because of missing demographic data (eFigure 3 in Supplement 1). The monthly median number of specimens contributed by individual study regions was 1878 (25th-75th percentile, 1396-2296). Compared with the general population residing within the study regions, significantly more blood donors in the study were non-Hispanic White (85.0% vs 61.2%) and aged 50 to 64 years (36.5% vs 24.4%); significantly fewer donors were aged 16 to 29 years (12.1% vs 24.1%), Hispanic (6.2% vs 17.1%), non-Hispanic Asian (2.9% vs 6.2%), or non-Hispanic Black (2.5% vs 12.7%) (Table 1).
Studywide Seroprevalence Trends
From July through December 2020, the studywide infection-induced seroprevalence estimate increased from 3.5% (95% CI, 3.2%-3.8%) to 11.5% (95% CI, 11.1%-11.8%) (Figure 1; eFigure 4 and eFigure 5 in Supplement 1). After the FDA issued the first Emergency Use Authorization for a COVID-19 vaccine, COVID-19 vaccine administration began on December 14, 2020. By May 2021, the combined infection- and vaccination-induced seroprevalence estimate increased to 83.3% (95% CI, 82.9%-83.7%), and the infection-induced seroprevalence estimate increased to 20.2% (95% CI, 19.9%-20.6%) (Figure 1 and Figure 2).
Studywide Seroprevalence Trends Stratified by Census Region and by Demographic Group
In July 2020, the infection-induced seroprevalence estimate for the Northeast (6.8% [95% CI, 5.5%-8.3%]) was significantly higher than estimates for other Census regions (Figure 3; eFigure 5 in Supplement 1). In September 2020, infection-induced seroprevalence estimates for the Northeast (5.9% [95% CI, 5.3%-6.6%) and South (6.0% [95% CI, 5.6%-6.5%]) were significantly higher than estimates for the West (3.4% [95% CI, 3.1%-3.8%]) and Midwest (3.8% [95% CI, 3.4%-4.2%]). In December 2020, the infection-induced seroprevalence estimate for the Midwest (15.8% [95% CI, 15.1%-16.5%]) was significantly higher than estimates for other Census regions. In May 2021, the infection-induced seroprevalence estimates for the Midwest (23.5% [95% CI, 22.7%-24.3%]) and South (22.2% [95% CI, 21.7%-22.8%]) were significantly higher than estimates for the Northeast (19.3% [95% CI, 18.2%-20.5%]) and West (16.7% [95% CI, 16.1%-17.2%]). The combined seroprevalence estimate for the Northeast (87.2% [95% CI, 86.2%-88.2%]) was significantly higher than estimates for other Census regions and the estimate for the South (80.2% [95% CI, 79.6%-80.8%]) was significantly lower in May 2021.
For all months, infection-induced seroprevalence estimates for persons aged 16 to 29 years (5.5% [95% CI, 4.6%-6.6%] in July 2020 and 27.0% [95% CI, 25.7%-28.4%] in May 2021) were significantly higher than infection-induced estimates for all other age groups, and the infection-induced estimates for persons aged 65 years and older (1.3% [95% CI, 1.0%-1.8%] in July 2020 and 11.7% [95% CI, 11.2%-12.2%] in May 2021) were significantly lower (Figure 3). However, in May 2021, the combined seroprevalence estimate for persons aged 65 years and older (92.2% [95% CI, 91.8%-92.7%]) was significantly higher than combined seroprevalence estimates for other age groups; the combined seroprevalence estimate for persons aged 16 to 29 years (76.1% [95% CI, 75.0%-77.2%]) was significantly lower.
From July through November 2020, the infection-induced seroprevalence estimates for men and women did not significantly differ (Figure 3). From December 2020 through May 2021, the monthly combined seroprevalence estimates for women were significantly higher than the corresponding monthly estimates for men. In May 2021, the combined seroprevalence estimate was 84.2% (95% CI, 83.7%-84.6%) for women and 82.3% (95% CI, 81.8%-82.9%) for men. However, the infection-induced seroprevalence estimates for women (20.2% [95% CI, 19.7%-20.6%]) and men (20.3% [95% CI, 19.8%-20.9%]) did not significantly differ in May 2021.
Among racial and ethnic groups, the infection-induced seroprevalence estimates in July 2020 for Hispanic (6.8% [95% CI, 5.8%-8.1%]) and non-Hispanic Black (6.6% [95% CI, 4.7%-9.3%]) persons were significantly higher than infection-induced estimates for other racial and ethnic groups (Figure 3). For the infection-induced seroprevalence in May 2021, the estimate for Hispanic persons (30.0% [95% CI, 28.7%-31.4%]) was significantly higher than the estimates of all other racial and ethnic groups, the estimate for non-Hispanic Black persons (21.1% [95% CI, 19.4%-23.0%]) was significantly higher than the estimates for all other racial and ethnic populations except Hispanic persons, and the estimate for non-Hispanic Asian persons (13.0% [95% CI, 11.7%-14.3%]) was significantly lower than the estimates for other racial and ethnic groups, including non-Hispanic White persons (18.5% [95% CI, 18.2%-18.8%]). The combined seroprevalence estimates in May 2021 for non-Hispanic Asian persons (91.0% [95% CI, 89.6%-92.2%]) was significantly higher than the estimates for all other racial and ethnic populations, and the estimate for non-Hispanic White persons (83.8% [95% CI, 83.5%-84.0%]) was significantly higher than the estimates for non-Hispanic Black (79.2% [95% CI, 77.1%-81.2%) and Hispanic (81.5% [95% CI, 80.2%-82.7%]) persons.
Seroprevalence estimates restricted to blood samples contributed by organizations that participated for the entire duration of the study (beginning July 2020) are shown in eFigure 6 in Supplement 1.
Among 92 390 blood donation specimens collected during May 2021 from donors with known COVID-19 vaccine status, 67 731 (73.3%) reported receiving a previous COVID-19 vaccine.
Comparison of Cumulative Case Reporting Rate and Seroprevalence
Based on infection-induced seroprevalence estimates, the estimated number of SARS-CoV-2 infections per reported COVID-19 case decreased from 3.1 (95% CI, 2.8-3.4) in July 2020 to 2.1 (95% CI, 2.0-2.1) in May 2021 (Table 2) but varied by study region (eTable 6 in Supplement 2).
In this nationwide study that included more than 1.4 million blood donation specimens from July 2020 through May 2021, vaccine- and infection-induced SARS-CoV-2 seroprevalence increased over time and varied by age, race and ethnicity, and geographic region. Introduction of SARS-CoV-2 vaccines resulted in increased population spike antibody seroprevalence.
These data demonstrate the increases in SARS-CoV-2 seroprevalence that occurred due to vaccination and illustrate differences in infection- and vaccine-induced antibody prevalence. The study will continue until at least December 2021, and results will be made available on the CDC’s website.1 Infection-induced seroprevalence (indicating the proportion of population previously infected) and combined seroprevalence (which might indicate the proportion of population potentially protected from infection) can supplement public health surveillance to identify groups potentially at higher risk of infection to implement public health prevention measures. These data can also inform infectious disease modeling and other research (eg, estimating infection-mortality ratios, ecologic analyses of associations between population immunity and case incidence).
Additional research is needed on the association between combined seroprevalence, protection, and herd immunity. Several large studies have shown that among individuals who are seropositive from prior SARS-CoV-2 infection, COVID-19 incidence is reduced by 80% to 95%, similar to vaccine efficacy estimates.22,23 However, infection- and vaccination-induced protection might be reduced in the setting of SARS-CoV-2 variants, and infection-induced protection might wane more quickly than vaccine-induced protection.22 Limited evidence suggests quantitative spike binding antibody and neutralizing antibody titers correlate with vaccine-induced protection, but it is unknown whether this correlation will persist as antibody levels wane or apply to infection-induced antibodies.24–26 Additional research is also needed on how humoral and cellular immunity contribute to protection after infection and vaccination.22
Infection-induced SARS-CoV-2 seroprevalence was consistently highest in Hispanic and non-Hispanic Black persons, mirroring case trends.1 However, by May 2021, non-Hispanic Asian and White persons had significantly higher combined seroprevalence estimates, likely because non-Hispanic Asian and White persons received vaccinations at a greater rate than Hispanic and non-Hispanic Black persons.27 Despite having disproportionately higher COVID-19 mortality rates, persons aged 65 years and older consistently had the lowest infection-induced seroprevalence, consistent with other seroprevalence studies and case data1,8,28,29 and potentially attributable to immunosenescence or older US adults practicing COVID-19 prevention behaviors more than younger persons.30,31
Seroprevalence estimates indicate that the number of COVID-19 cases reported are fewer than the number of SARS-CoV-2 infections that have occurred, likely because many mildly symptomatic and asymptomatic individuals did not seek testing or clinical care.2 The data in this study suggest that for every COVID-19 case reported, the number of people infected and with detectable SARS-CoV-2 antibodies decreased from 3.1 in July 2020 to 2.1 in May 2021. A previous blood donor seroprevalence study reported a similarly decreasing ratio from March through August 2020 for 6 regions.14 Increases in testing supplies, access to testing, and serial testing programs at universities, long-term care facilities, and other locations may have contributed to increased case detection and reporting,32–34 but waning of antibodies may also be contributing.
This study has several limitations. First, while seroprevalence estimates were weighted to account for demographic differences between the sample blood donor population and general population, the blood donor population differed from the general adult US population in measurable demographic variables, while other potential population differences could not be measured.
Second, although the serology assays used appear to have high sensitivity for 6 months after infection,15 estimates were not adjusted to account for a sensitivity less than 100% or potential waning of sensitivity after 6 months.
Third, infection-induced seroprevalence estimates might be underestimated because persons with acute or long-term COVID-19 symptoms might have been excluded from donating.35 However, influenza seroprevalence studies have shown similar influenza infection rates in blood donors and the general population, suggesting SARS-CoV-2 infection-induced seroprevalence might also be similar in blood donors and the general population36; additionally, the infection-induced seroprevalence estimates in this study were similar to those of a nationwide seroprevalence study using commercial laboratory specimen remnants.1,29
Fourth, vaccine-induced seroprevalence might be higher in blood donors than in the general population. For May 2021, among donations from donors with a known vaccine history, 73.3% were from donors who self-reported receiving a previous COVID-19 vaccine, compared with CDC estimates that 57.0% of US adults aged 18 years and older had received 1 dose or more of vaccine by May 2021.37 Blood donors are more likely than the general US population to be employed and have attended college,38 factors potentially associated with increased rates of vaccination and lower rates of infection.39,40
Fifth, the combined and infection-induced seroprevalence estimates might be overestimates because several participating blood collection organizations implemented and advertised SARS-CoV-2 antibody testing for blood donors, potentially attracting donors who were exposed.8 However, the effect of test-seeking donors was likely low given that test seeking would have been more likely among first-time donors, who contributed 13.9% of study specimens.
Sixth, the studywide estimates only represented the geographic areas covered by study regions, which covered an estimated 74% of the US population.
Seventh, the zip code–based study region seroprevalences were compared with county-based cumulative case report rates; counties only partially represented by study region zip codes may have had case report rates that differed between included and excluded zip codes in the study regions.
Eighth, the analysis of infections per reported case is ecological. The seroprevalence estimates and cumulative case reporting data applied to broad geographic areas; the true values likely vary based on local patterns of transmission, testing for COVID-19, and other factors. Therefore, the estimated number of cumulative infections per reported case should be interpreted with caution.
Ninth, children aged younger than 16 years cannot donate blood and were not included in this study.
Tenth, the findings in this analysis predate the surge in SARS-CoV-2 infection in the US related to transmission of the Delta variant.
Based on a sample of blood donations in the US from July 2020 through May 2021, vaccine- and infection-induced SARS-CoV-2 seroprevalence increased over time and varied by age, race and ethnicity, and geographic region. Despite weighting to adjust for demographic differences, these findings from a national sample of blood donors may not be representative of the entire US population.
Corresponding Author: Jefferson M. Jones, MD, MPH, CDR, US Public Health Service, Seroprevalence Team Lead, Epidemiology Task Force, Centers for Disease Control and Prevention COVID-19 Response, 1600 Clifton Rd NE, MS V18-4, Atlanta, GA 30329-4027 (ioe8@cdc.gov).
Accepted for Publication: August 19, 2021.
Published Online: September 2, 2021. doi:10.1001/jama.2021.15161
Author Contributions: Dr Opsomer had full access to all of the data in the study and takes responsibility for the integrity of the data and the accuracy of the data analysis.
Concept and design: Jones, Stone, Sulaeman, Saa, Biggerstaff, Strauss, Destree, Nguyen, Weales, Brown, Gould, Miller, Fry, Hall, Gundlapalli, Basavaraju, Patton, Simmons, Thornburg, Kleinman, Stramer, Busch.
Acquisition, analysis, or interpretation of data: Jones, Stone, Sulaeman, Fink, Dave, Levy, Di Germanio, Green, Notari, Saa, Biggerstaff, Kessler, Vassallo, Reik, Rossmann, Nguyen, Sayers, Lough, Bougie, Ritter, Latoni, Sime, Gorlin, Brown, Berney, Benoit, Miller, Freeman, Kartik, Azziz-Baumgartner, Hall, MacNeil, Gundlapalli, Basavaraju, Gerber, Patton, Custer, Williamson, Simmons, Kleinman, Stramer, Opsomer, Busch.
Drafting of the manuscript: Jones, Saa, Ritter, Miller, Freeman, Kartik, Gundlapalli, Basavaraju, Stramer, Opsomer, Busch.
Critical revision of the manuscript for important intellectual content: Jones, Stone, Sulaeman, Fink, Dave, Levy, Di Germanio, Green, Notari, Saa, Biggerstaff, Strauss, Kessler, Vassallo, Reik, Rossmann, Destree, Nguyen, Sayers, Lough, Bougie, Ritter, Latoni, Weales, Sime, Gorlin, Brown, Gould, Berney, Benoit, Miller, Fry, Azziz-Baumgartner, Hall, MacNeil, Gundlapalli, Basavaraju, Gerber, Patton, Custer, Williamson, Simmons, Thornburg, Kleinman, Stramer, Busch.
Statistical analysis: Jones, Sulaeman, Levy, Biggerstaff, Berney, Freeman, Kartik, Opsomer, Busch.
Obtained funding: Stone, Saa, Gould, Hall, Patton, Simmons, Stramer, Busch.
Administrative, technical, or material support: Jones, Stone, Sulaeman, Fink, Dave, Levy, Di Germanio, Green, Notari, Saa, Strauss, Kessler, Vassallo, Reik, Rossmann, Destree, Nguyen, Sayers, Lough, Bougie, Ritter, Latoni, Weales, Sime, Gorlin, Brown, Gould, Berney, Benoit, Miller, Azziz-Baumgartner, Hall, Gundlapalli, Basavaraju, Gerber, Patton, Custer, Williamson, Simmons, Thornburg, Stramer, Busch.
Supervision: Jones, Stone, Sulaeman, Saa, Reik, Ritter, Gould, Fry, Hall, MacNeil, Gundlapalli, Patton, Custer, Thornburg, Stramer, Opsomer, Busch.
Conflict of Interest Disclosures: The Gulf Coast Regional Blood Center uses Roche assays for testing and Dr Rossmann reported serving as principal investigator on Roche blood donor testing, for which she received no direct compensation outside the submitted work. Dr Sime reported collecting convalescent plasma from blood donors for LifeServe Blood Center during the time samples were collected outside the submitted work. Dr Kartik reported receiving personal fees from Brigham and Women’s Hospital and PathAI outside the submitted work. Dr Custer reported receiving personal fees and grants from Grifols Diagnostic Solutions outside the submitted work. Dr Kleinman reported receiving personal fees from Creative Testing Solutions and Roche Molecular Systems outside the submitted work. Dr Stramer reported receiving a contract from the CDC via Vitalant Research Institute outside the submitted work. Dr Busch reported being an employee of Vitalant Research Institute and serving on the medical advisory board for Creative Testing Systems; Vitalant Research Institute receives research funds and reagents for studies from Ortho and Roche and Dr Busch has presented on behalf of both companies at meetings in the past with travel support but does not receive personal compensation from these or other SARS-CoV-2 test manufacturing companies. No other disclosures were reported.
Funding/Support: This study was funded by the CDC.
Role of the Funder/Sponsor: CDC employees contributed to the design and conduct of the study; collection, management, analysis, and interpretation of the data; preparation, review, or approval of the manuscript; and decision to submit the manuscript for publication. The CDC did not have the right to veto publication or to control the decision regarding to which journal the study was submitted.
Disclaimer: The findings and conclusions in this report are those of the authors and do not necessarily represent the official position of the CDC.
Additional Contributions: We thank members from Vitalant Research Institute, Westat, the American Red Cross, each of the 17 participating blood collection organizations and 10 testing laboratories, and Georgia Tech Research Institute for their assistance on this study.
2.
Reese H, Iuliano AD, Patel NN, et al. Estimated incidence of coronavirus disease 2019 (COVID-19) illness and hospitalization: United States, February-September, 2020.
Clin Infect Dis. 2021;72(12):e1010-e1017. doi:
10.1093/cid/ciaa1780PubMedGoogle ScholarCrossref3.
Petersen LR, Sami S, Vuong N, et al. Lack of antibodies to SARS-CoV-2 in a large cohort of previously infected persons.
Clin Infect Dis. Published November 4, 2020.
PubMedGoogle Scholar4.
Busch MP, Stone M. Serosurveillance for severe acute respiratory syndrome coronavirus 2 (SARS-CoV-2) incidence using global blood donor populations.
Clin Infect Dis. 2021;72(2):254-256. doi:
10.1093/cid/ciaa1116PubMedGoogle ScholarCrossref9.
HHS Regulations for the Protection of Human Subjects in Research. 45 CFR §46 (2018).
10.
Institutional Review Boards. 21 CFR §56 (2020).
11.
Protection of privacy of individuals who are research subjects, 42 USC §241(d) (2011).
12.
Records maintained on individuals, 5 USC §552a (2010).
13.
Paperwork Reduction Act, 44 USC §3501 et seq (1995).
14.
Stone M, Di Germanio C, Wright DJ, et al; NHLBI Recipient Epidemiology and Donor Evaluation Study-IV-Pediatric (REDS-IV-P). Use of US blood donors for national serosurveillance of SARS-CoV-2 antibodies: basis for an expanded national donor serosurveillance program.
Clin Infect Dis. Published June 10, 2021. doi:
10.1093/cid/ciab537PubMedGoogle Scholar15.
Peluso MJ, Takahashi S, Hakim J, et al. SARS-CoV-2 antibody magnitude and detectability are driven by disease severity, timing, and assay.
Sci Adv. 2021;7(31):eabh3409. doi:
10.1126/sciadv.abh3409PubMedGoogle Scholar24.
Feng S, Phillips DJ, White T, et al; Oxford COVID Vaccine Trial Group. Correlates of protection against symptomatic and asymptomatic SARS-CoV-2 infection.
medRxiv. Published June 24, 2021. doi:
10.1101/2021.06.21.21258528Google Scholar27.
Pingali C, Meghani M, Razzaghi H, et al. COVID-19 vaccination coverage among insured persons aged ≥16 years, by race/ethnicity and other selected characteristics – eight integrated health care organizations, United States, December 14, 2020-May 15, 2021.
MMWR Morb Mortal Wkly Rep. 2021;70(28):985-990. doi:
10.15585/mmwr.mm7028a1PubMedGoogle ScholarCrossref34.
Pray IW, Ford L, Cole D, et al; CDC COVID-19 Surge Laboratory Group. Performance of an antigen-based test for asymptomatic and symptomatic SARS-CoV-2 testing at two university campuses: Wisconsin, September-October 2020.
MMWR Morb Mortal Wkly Rep. 2021;69(5152):1642-1647. doi:
10.15585/mmwr.mm695152a3PubMedGoogle ScholarCrossref38.
Patel EU, Bloch EM, Grabowski MK, et al. Sociodemographic and behavioral characteristics associated with blood donation in the United States: a population-based study.
Transfusion. 2019;59(9):2899-2907. doi:
10.1111/trf.15415PubMedGoogle ScholarCrossref39.
Barry V, Dasgupta S, Weller DL, et al. Patterns in COVID-19 vaccination coverage, by social vulnerability and urbanicity: United States, December 14, 2020-May 1, 2021.
MMWR Morb Mortal Wkly Rep. 2021;70(22):818-824. doi:
10.15585/mmwr.mm7022e1PubMedGoogle ScholarCrossref