
Source article: https://www.cell.com/cell-reports-medicine/fulltext/S2666-3791(21)00203-2#relatedArticles
PDF:
Extract:
Highlights
-
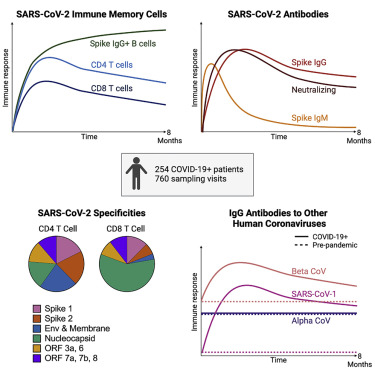
Most recovered COVID-19 patients mount broad, durable immunity after infection
-
Neutralizing antibodies show a bi-phasic decay with half-lives >200 days
-
Spike IgG+ memory B cells increase and persist post-infection
-
Durable polyfunctional CD4 and CD8 T cells recognize distinct viral epitope regions
Summary
Graphical abstract
Keywords
Introduction
The COVID-19 pandemic caused by the rapid spread of SARS-CoV-2, a novel betacoronavirus, continues to cause significant morbidity and mortality. The induction of effective early immune control of SARS-CoV-2 and durable immune memory is critical to prevent severe disease and to protect upon re-exposure. SARS-CoV-2 infection induces polyclonal humoral and cellular responses targeting multiple viral proteins described in cross-sectional and longitudinal studies.
More comprehensive, quantitative analyses with extensive serial sampling in larger numbers of COVID-19 patients are limited and could resolve some conflicting views about the durability of humoral immunity. Importantly, defining the frequency, immune function, and specificity of the antibodies; memory B and T cell responses among COVID-19 patients; and identifying when they appear and how long they persist can provide understanding of the integral components for long-lived immunity to SARS-CoV-2 and potentially other human coronaviruses that emerge in the future.
We initiated two prospective COVID-19 patient cohorts in Seattle and Atlanta during the first surge of the pandemic to investigate long-term immunity to SARS-CoV-2. Among 254 COVID-19 patients enrolled and frequently sampled, we identify binding and neutralizing antibodies to SARS-CoV-2 as well as antigen-specific B and T cells elicited early after infection, define their specificities, quantify the extent of antibody boosting of cross-reactive responses to other coronaviruses, and further characterize the decay rate and durability of these immune parameters over 250 days. We employ highly standardized or validated assays that are also being used to evaluate immunity in recent and ongoing clinical vaccine trials.
,
,
This in-depth longitudinal study demonstrates that durable immune memory persists in most COVID-19 patients, including those with mild disease, and serves as a framework to define and predict long-lived immunity to SARS-CoV-2 after natural infection. This investigation will also serve as a benchmark for immune memory induced in humans by SARS-CoV-2 vaccines.
Results
COVID-19 study population
Antibody responses to SARS-CoV-2 spike protein show a bi-phasic decay with an extended half-life
The magnitude of serum IgG antibodies binding to the SARS-CoV-2 spike protein increased in 92% of COVID-19 convalescent participants (n = 222) relative to pre-pandemic controls (Figure 1A). The IgG responses to SARS-CoV-2 spike, RBD, and NTD declined over time with half-lives of 126 (95% confidence interval [95% CI] [107, 154]), 116 (95% CI [97, 144]), and 130 (95% CI [110, 158]) days, respectively, as estimated by an exponential decay model (Figures 1A–1C and S1A). We also estimated antibody waning using a power law model, which models a scenario in which the rate of antibody decay slows over time. The power law model produced a better fit for the decay of the SARS-CoV-2 spike, RBD, and NTD binding IgG antibodies (DAICs > 10), suggesting that spike-specific antibodies plateau over time. Because the decay rate changes over time, the half-life is predicted to change over time as well; therefore, we used the power law model to estimate the half-lives at 120 days after symptom onset. The power law estimated half-lives for the IgG antibody responses to spike (t1/2 = 238 days), RBD (t1/2 = 209 days), and NTD (t1/2 = 244 days) were longer than those estimated by the exponential decay model (Figures S1A and S1C), indicating that the concentration of these IgG antibodies may be starting to stabilize. IgA (Figures 1D–1F) and IgM (Figures 1G–1I) antibodies reactive to the SARS-CoV-2 spike also increased after SARS-CoV-2 infection but were detected at lower levels and declined faster than the SARS-CoV-2-reactive IgG antibodies. As expected, spike-binding IgM decayed more rapidly than spike-binding IgA and IgG. Taken together, these results show that antibody responses, especially IgG antibody, were not only durable in the vast majority of patients in the 250 day period, but also that the bi-phasic decay curve suggests the generation of longer lived plasma cells producing antibody to the SARS-CoV-2 spike protein.

Stable and long-lived antibody responses to common human alpha- and betacoronaviruses in pre-pandemic healthy controls
We were interested in determining if SARS-CoV-2 infection had any effect on the levels of antibody to the circulating human alpha- and betacoronaviruses. As a prelude to this question, we first examined antibody levels to the spike protein of the two circulating alphacoronaviruses (229E and NL63) and the two betacoronaviruses (HKU1 and OC43) in our pre-pandemic samples. As shown in Figure 2, all 51 pre-pandemic samples had clearly detectable levels of IgG and IgA antibodies to the spike proteins of the four human coronaviruses. This is the expected result since seropositivity to these coronaviruses is very high in the adult population, but what was quite interesting was the remarkable stability of these antibody responses over a 200-day period in the pre-pandemic serum samples (shown as red lines in Figure 2). These were essentially flat lines with no decline in the antibody levels and question the prevailing belief that antibody responses to the endemic coronaviruses are short-lived.
,
,
While some occasional boosting of these childhood-acquired coronavirus infections cannot be ruled out, these data showing such stable antibody titers are best explained by the persistence of long-lived plasma cells in the bone marrow many years after infection.
,
,
,
,

COVID-19 infection results in increased levels of antibodies to two common human betacoronaviruses (HKU1 and OC43) and to SARS-CoV-1
We next examined if SARS-CoV-2 infection had any impact on the levels of antibodies to the other human coronaviruses. We measured IgG, IgA, and IgM antibody binding to the spike proteins of other known human coronaviruses in the COVID-19 patients (n = 222 for IgG and n = 190 for IgA and IgM) and compared these data to the 51 pre-pandemic healthy donor samples. In the COVID-19 patients, IgG and IgA antibodies to the alphacoronaviruses 229E and NL63 did not show any significant changes compared to the antibody levels in the pre-pandemic healthy controls (Figures 2A, 2B, 2F, and 2G; Figures S1C and S1D). In contrast, the IgG and IgA antibodies to betacoronaviruses HKU1 and OC43 were substantially elevated in COVID-19 patients relative to pre-pandemic controls (Figures 2C, 2D, 2H, and 2I; Figures S1C and S1D; p < 0.0001). After this boost, HKU1 and OC43 IgG antibody levels declined with estimated half-lives of 288 (95% CI [235, 372]) and 212 (95% CI [176, 268]) days, respectively (exponential decay model). IgM levels to common betacoronaviruses HKU1 and OC43 were low in both pre-pandemic controls and COVID-19 patients (Figures 2M and 2N). While pre-existing exposure and antibodies against HKU1 and OC43 betacoronaviruses are common in adults, pre-existing SARS-CoV-1 exposure is rare and antibody levels to SARS-CoV-1 spike protein were very low (essentially negative) in the pre-pandemic healthy controls. However, SARS-CoV-1 spike-reactive antibodies increased significantly after SARS-CoV-2 infection. These increases were quite striking for IgG (p = 0.0038) and also IgA (p = 0.0084) and most likely represent cross-reactive antibodies directed to SARS-CoV-2 spike epitopes that are conserved between SARS-CoV-2 and SARS CoV-1
. These newly induced cross-reactive IgG antibodies generated after COVID-19 infection declined with an estimated half-life of 215 days (95% CI [168, 298]) (exponential decay model) (Figure 2). Taken together, these results show that people infected with SARS-CoV-2 may have also have some heightened immunity against the common human betacoronaviruses and more importantly against SARS-CoV-1.
Durable neutralizing antibody responses to SARS-CoV-2 in infected patients
Neutralizing antibodies were measured with a live virus focus reduction neutralization test that uses a recombinant SARS-CoV-2 virus expressing the fluorescent reporter gene mNeonGreen (FRNT-mNG) (Figure 3A). During the first 250 days post-symptom onset, FRNT50 titers varied considerably between individuals and ranged from < 20 to 3726 (Figure 3A). Of the 183 individuals for whom longitudinal neutralization titers were assayed, 140 (77%) had at least one time point with neutralization titers above the limit of detection (> 20). Seventy-five percent (43/57) of COVID-19 patients generated serum neutralizing antibodies between 30–50 days after symptom onset and similarly 72% (48/67) had measurable titers between 180–263 days after symptom onset. Using an exponential decay model, we evaluated the kinetics of neutralizing antibody titers after day 42 and estimated a half-life of 150 days (95% CI [124, 226]). However, similar to the spike-reactive IgG binding antibodies, we hypothesized that the neutralizing antibody rate of decay may actually slow over time during the recovery period. To address this, we fit a power law to the data. The power law model fit significantly better than the exponential decay model (DAIC = 9) and estimated the half-life of neutralizing antibody responses at 120 days post-symptom onset to be 254 days (95% CI [183, 400]).

SARS-CoV-2 spike and RBD-specific memory B cells increase for several months after infection and then plateau over 8 months
Memory B cells (MBC) are an important component of humoral immunity and contribute to viral control by generating antibody responses upon re-exposure to the pathogen. We used full-length spike and RBD antigen probes to quantify the frequencies of SARS-CoV-2 spike- and RBD-specific MBC in longitudinal PBMC samples from 111 COVID-19 patients (Figure 4) and from 29 pre-pandemic controls (Figures S3A and S3B). Our flow cytometric gating strategy to identify SARS-CoV-2-specific MBC and classify them as IgG, IgM, and IgA MBC isotypes is shown in Figure 4A.

Induction of durable and polyfunctional virus specific memory CD4+ and CD8+ T cells in infected patients
Among COVID-19 patients, 89% (102/113) mounted CD4+ T cell responses (Figure 5A) recognizing at least one SARS-CoV-2 structural protein that was detectable at one or more visits. By contrast, SARS-CoV-2 specific CD4+ T cells were rarely detected in the uninfected control group using this assay (Figure S3C). Antigen-specific CD4+ T cells expanded over the first month after infection and then gradually declined over subsequent months. Their estimated half-life was 207 days (95% CI [104, 211]) as shown in Figure 5A, and these findings are supported by the individual CD4+ T cell response levels and slopes after day 30 (slope = −0.0033, 95% CI [-0.0017, −0.0066], p < 0.0001) (Figures S4C and S4D). Of note, we observed a wide range in the total magnitude of responses, some reaching >1% of circulating CD4+ T cells, and an overall median frequency of 0.51% (Figures 5A and S5).

Next, we examined the CD8+ T cell responses in COVID-19 patients and found that 69% generated CD8+ T cells recognizing at least one SARS-CoV-2 structural protein that were detectable at one or more visits (Figure 6A), in contrast to infrequent to rare, low-level antigen-specific responses in the uninfected control donors (Figure S3D). Expansion of CD8+ T cells occurred over the first month and then frequencies gradually declined, with a half-life of 196 days (95% CI [92, 417]) and a negative estimated slope after 30 days of symptom onset (slope = −0.004, 95% CI [-0.002, −0.008], p < 0.0001) (Figure 6A). The median frequency of SARS-CoV-2-specific CD8+ T cells was 0.2%, indicating a lower overall response magnitude than observed for CD4+ T cells. However, like the CD4+ T cells, a wide range in magnitudes was observed with many SARS-CoV-2-specific CD8+ T cell frequencies above 1% and even up to 12% (Figure 6A).

The SARS-CoV-2-specific CD8+ T cells were highly polyfunctional with the highest magnitude populations secreting IFN-γ, TNF-α, and granzyme B; other dominant subsets also expressed IL-2 or perforin (Figures 6C and 6D). This polyfunctional profile was seen in the expansion phase (median 30 days; Figure 6C) and also at the later time points (>180 days post symptom onset; median 203 days; Figure 6D). It is important to note that this pattern of CD8+ T cell differentiation has been described in detail after vaccination in humans with the live attenuated yellow fever virus vaccine (YFV-17D).
This YFV-17D vaccine generates long-lived and functional virus-specific memory CD8+ T cells that persist in humans for decades.
,
That the CD8+ T cell differentiation program after COVID-19 infection resembles what is seen after YFV infection of human suggests that COVID-19 patients may also generate long-lived CD8+ T cell memory.
CD4+ and CD8+ cells target different SARS-CoV-2 antigen specificities
Age and disease severity are significantly associated with magnitude of SARS-CoV-2 immune responses
We evaluated whether COVID-19 patient age, disease severity, or gender could account in part for the heterogeneity observed among the SARS-CoV-2-specific immune responses as estimated from the individual models (post day 30 for cellular and post day 42 for antibody responses). We observed that age was significantly associated with higher immune responses to SARS-CoV-2, independently of any covariation with disease severity (Figure 7A). Neutralizing antibody titers and IgG antibody responses to nucleocapsid increased 1.35-fold and 1.25-fold, respectively, with each decade of age and the same disease severity (95% Cis [1.19, 1.54] and [1.08, 1.43], p values < 0.003). Similarly, increased age positively correlated with increased frequencies of spike and RBD-specific IgG+ memory B cells, with 1.19- to 1.24-fold higher responses per decade of age (p values < 0.02; Figure 7A), accounting for disease severity. Increased age also correlated with higher SARS-CoV-2 and S1-specific CD4+ T cell responses (1.16- to 1.20-fold increase by decade of age, p values < 0.02) and N-specific CD8+ T cell responses (1.24-fold increase by decade of age, p = 0.039) accounting for disease severity (Figure 7A).

Early SARS-CoV-2 B and T cell responses correlated with durable spike and RBD IgG antibody binding and neutralization titers
Discussion
Some antibodies that bind to specific epitopes on the spike RBD and NTD can block SARS-CoV-2 infection of respiratory epithelial cells by inhibiting the interactions of the viral spike with the ACE2 receptor.
,
,
,
Thus, as expected, the early rise and decline of antibodies neutralizing live SARS-CoV-2 were similar to the kinetics of antibodies binding the spike and RBD protein. The striking finding is the bi-phasic curve of the spike-specific binding and neutralizing antibody responses when analyzed with the power law model, which provides a better fit for the antibody kinetics after the peak response.
This bi-phasic decline accords with other recently published observations on SARS-CoV-2 serological kinetics.
,
With sampling data extended to 250 days, we were able to detect a slowing of the decay of these functional antibodies toward a plateau level, suggestive of the generation of longer-lived plasma cells, and durable antibody responses. The importance of these observations is that following recovery, neutralizing antibodies may persist, albeit at low levels, and may act as the first line of defense against future encounters of SARS-CoV-2 and possibly related human coronaviruses.
Another interesting finding of this investigation is the remarkably stable antibody responses among the pre-pandemic and COVID-19 patients to the common human coronaviruses that are acquired in children and adults. These data are most consistent with the generation of long-lived plasma cells and refute the current notion that these antibody responses to human coronaviruses are short lived. Moreover, the COVID-19 patients mounted increased IgG antibody responses to SARS-CoV-1, a related pathogen that none likely had experienced previous exposure to. This finding is consistent with the booster response of SARS-CoV-1 neutralizing antibodies that we recently observed following SARS-CoV-2 mRNA vaccination.
,
Taken together, these results may have implications for a broader strategy for vaccines targeting multiple betacoronaviruses.
The durable antibody responses in the COVID-19 recovery period are further substantiated by the ongoing rise in both the spike and RBD memory B cell responses after over 3–5 months before entering a plateau phase over 6–8 months. Persistence of RBD memory B cells has been noted.
,
,
We presume this may be explained by sustained production of memory B cells in germinal centers of lymph nodes draining the respiratory tract in the early months, followed by the memory B cell redistribution into the circulation as the germinal centers begin to recede. Thus, the induction and maintenance of memory B cells and, over time, long-lived plasma cells, will continue to furnish higher affinity antibodies if re-exposures occur.
The COVID-19 pandemic remains a global public health threat after 1 year of overwhelming disruption and loss. Overcoming the challenges to end the pandemic is accentuated by the recognition that SARS-CoV-2 can undergo rapid antigenic variation that may lower vaccine effectiveness in preventing new cases and progression to severe disease.
,
,
Our findings show that most COVID-19 patients induce a wide-ranging immune defense against SARS-CoV-2 infection, encompassing antibodies and memory B cells recognizing both the RBD and other regions of the spike, broadly-specific and polyfunctional CD4+ T cells, and polyfunctional CD8+ T cells. The immune response to natural infection is likely to provide some degree of protective immunity even against SARS-CoV-2 variants because the CD4+ and CD8+ T cell epitopes will likely be conserved. Thus, vaccine induction of CD8+ T cells to more conserved antigens such as the nucleocapsid, rather than just to SARS-CoV-2 spike antigens, may add benefit to more rapid containment of infection as SARS-CoV-2 variants overtake the prevailing strains.
Limitations of the study
Our study evaluates COVID-19 patients only up to 8 months and requires models to estimate immune response half-lives thereafter. Because our longitudinal study will extend beyond 2 years, we can corroborate our models with subsequent experimental data on the persistence of immune memory. Our study population was primarily outpatients with mild-to-moderate COVID-19 and thus we were unable to evaluate immune memory in those with the extreme presentations, both asymptomatic and severe COVID-19. However, mild-moderate illness accounts for >80% of COVID-19 cases
, highlighting the relevance of our findings over time.
STAR★Methods
Key resources table
| REAGENT or RESOURCE | SOURCE | IDENTIFIER |
|---|---|---|
| Antibodies | ||
| Mouse Anti-Human CD3/BV510 | BD Biosciences | 564713; RRID:AB_2738909 |
| Mouse Anti-Human CD14/BV510 | BD Biosciences | 563079; RRID:AB_2737993 |
| Mouse Anti-Human CD56/BV510 | BD Biosciences | 563041; RRID:AB_2732786 |
| Mouse Anti-Human CD19/BUV395 | BD Biosciences | 563549; RRID:AB_2738272 |
| Mouse Anti-Human CD20/BUV737 | BD Biosciences | 612849; RRID:AB_2870169 |
| Mouse Anti-Human CD21/PE-Cy7 | BD Biosciences | 561374; RRID:AB_10681717 |
| Mouse Anti-Human CD27/BV605 | BD Biosciences | 302830; RRID: AB_2561450 |
| Mouse Anti-Human CD38/BB700 | BioLegend | 566445; RRID:AB_2744375 |
| Mouse Anti-Human IgA/VioBlue | Miltenyi Biotec | 130-114-005; RRID:AB_2733958 |
| Mouse Anti-Human IgD/BV650 | BD Biosciences | 740594; RRID:AB_2740295 |
| Mouse Anti-Human IgG/BV786 | BD Biosciences | 564230; RRID:AB_2738684 |
| Mouse Anti-Human IgM/PE-Dazzle 594 | BioLegend | 314530; RRID:AB_2566483 |
| Streptavidin (PE) | Invitrogen | S21388; RRID:AB_2892541 |
| Streptavidin (AF488) | Invitrogen | S32354; RRID:AB_2315383 |
| Streptavidin (AF647) | Invitrogen | S32357; RRID:AB_2892542 |
| Live/Dead Fixable Aqua Stain | Invitrogen | L34957 |
| Fixable Viability Dye/eFluor 450 | Invitrogen | 65-0863 |
| Mouse Anti-Human CD14/BUV661 | BD Biosciences | 741684; RRID:AB_2868407 |
| Mouse Anti-Human CD19/BUV563 | BD Biosciences | 612916; RRID:AB_2870201 |
| Mouse Anti-Human CD16/BV570 | BioLegend | 302036; RRID:AB_2632790 |
| Mouse Anti-Human CD56/BV750 | BioLegend | 362556; RRID:AB_2801001 |
| Mouse Anti-Human CD3/APC-Fire750 | BioLegend | 300470; RRID:AB_2629689 |
| Mouse Anti-Human CD4/BV480 | BD Biosciences | 566104; RRID:AB_2739506 |
| Mouse Anti-Human CD8/BUV805 | BD Biosciences | 612889; RRID:AB_2833078 |
| Mouse Anti-Human CD197(CCR7)/BV605 | BioLegend | 353224; RRID:AB_2561753 |
| Mouse Anti-Human CD45RA/BUV496 | BD Biosciences | 750258; RRID:AB_2874456 |
| Mouse Anti-Human CD25/BV650 | BD Biosciences | 563719; RRID: AB2744337 |
| Rat Anti-Human FOXP3/PE-Cy5.5 | Invitrogen | 35-4776-42; RRID:AB_11218682 |
| Mouse Anti-Human CD32/PE-Dazzle | BioLegend | 303218; RRID:AB_2716072 |
| Mouse Anti-Human CD65/BV711 | BioLegend | 305042; RRID:AB_2800778 |
| Mouse Anti-Human CD183/PE-Cy5 | BD Biosciences | 551128; RRID:AB_394061 |
| Mouse Anti-Human CD196 (CCR6)/BV786 | BD Biosciences | 563704; RRID:AB_2738381 |
| Rat Anti-Human CD294 (CRTH2)/PE | BioLegend | 350106; RRID:AB_10900060 |
| Mouse Anti-Human IFN-g/V450 | BD Biosciences | 560371; RRID:AB_1645594 |
| Rat Anti-Human IL-2/APC | BioLegend | 500310; RRID:AB_315097 |
| Mouse Anti-Human TNF/BUV395 | BD Biosciences | 563996; RRID:AB_2738533 |
| Mouse Anti-Human IL-17A/PE-Cy7 | BioLegend | 512315; RRID:AB_2295923 |
| Rat Anti-Human IL-4/BB700 | BD Biosciences | Custom |
| Rat Anti-Human/Anti-Mouse IL-5/BB630 | BD Biosciences | Custom |
| Rat Anti-Human IL-13/BV421 | BD Biosciences | Custom |
| Mouse Anti-Human CD154 (BUV737) | BD Biosciences | 748983; RRID:AB_2873383 |
| Mouse Anti-Human Granzyme B/AF700 | BD Biosciences | 560213; RRID:AB_1645453 |
| Mouse Anti-Human Perforin/FITC | BD Biosciences | 353310; RRID:AB_2571967 |
| Mouse Anti-Human Ki-67/BB660 | BD Biosciences | Custom |
| Bacterial and virus strains | ||
| icSARS-CoV-2-mNG | Xie et a. | N/A |
| Chemicals, peptides, and recombinant proteins | ||
| SARS-CoV-2 Spike peptides | Biosynthesis | Custom |
| SARS-CoV-2 E, M, N and ORF peptides | Genscript | Custom |
| SARS-CoV-2 Spike protein (S6P) | Fred Hutchinson Cancer Research Center | Custom |
| SARS-CoV-2 RBD protein | Fred Hutchinson Cancer Research Center | Custom |
| Methylcellulose | Sigma-Aldrich | M0512-250G |
| TrueBlue Peroxidase Substrate | KPL | 5510-0050 |
| Critical commercial assays | ||
| V-PLEX COVID-19 Coronavirus Panel 2 (IgG) Kit | Meso Scale Discovery | K15369U |
| V-PLEX COVID-19 Coronavirus Panel 2 (IgA) Kit | Meso Scale Discovery | K15371U |
| V-PLEX COVID-19 Coronavirus Panel 2 (IgM) Kit | Meso Scale Discovery | K15370U |
| Experimental models: Cell lines | ||
| VeroE6 C1008 cells | ATCC | Cat# CRL-1586; RRID:CVCL_0574 |
| Software and algorithms | ||
| FlowJo | BD Biosciences | V9.9.4 |
| R | R Foundation for Statistical Computing | V3.6.1 |
| GraphPad Prism | GraphPad | V7, 8 and 9 |
| Viridot | Katzelnick et al. | https://github.com/leahkatzelnick/Viridot |
| Monolix | Lixoft | MonolixSuite2019R1 |
| Other | ||
| ELISPOT reader | Immunospot | CTL ImmunoSpot S6 Universal Analyzer |
Resource availability
Lead contact
Materials availability
Data and code availability
Experimental model and subject details
Study populations
Longitudinal pre-pandemic sera samples from Emory were collected from individuals participating in a yellow fever vaccine study from 2014-2016 or an influenza vaccine study from 2015-2018
,
. Data were included for analysis of binding antibody responses and are presented as days post-irrelevant (yellow fever) vaccination. The study was approved by the Emory University IRB and donors were enrolled after providing written informed consent.
Method details
PBMC processing
PBMC for cellular assays were isolated by density centrifugation and cryopreserved from ACD-anticoagulated whole blood within eight h of venipuncture, as described previously
. Sera were also processed and cryopreserved within 4 h after collection.
Antibody binding assay
Viruses and cell lines
VeroE6 cells were obtained from ATCC (clone E6, ATCC, #CRL-1586) and cultured in complete DMEM medium consisting of 1 × DMEM (VWR, #45000-304), 10% FBS, 25mM HEPES Buffer (Corning Cellgro), 2mM L-glutamine, 1mM sodium pyruvate, 1 × Non-essential Amino Acids, and 1 × antibiotics. The infectious clone SARS-CoV-2 (icSARS-CoV-2-mNG), derived from the 2019-nCoV/USA_WA1/2020 strain, was propagated in VeroE6 cells and sequenced
,
.
Focus reduction neutralization test
Neutralization assays with SARS-CoV-2 virus were performed as previously described
,
,
. Plasma/serum were serially diluted (three-fold) in serum-free Dulbecco’s modified Eagle’s medium (DMEM) in duplicate wells and incubated with 100–200 FFU infectious clone derived SARS-CoV-2-mNG virus at 37°C for 1 h
. The antibody-virus mixture was added to VeroE6 cell (C1008, ATCC, #CRL-1586) monolayers seeded in 96-well blackout plates and incubated at 37°C for 1 h. Post-incubation, the inoculum was removed and replaced with pre-warmed complete DMEM containing 0.85% methylcellulose. Plates were incubated at 37°C for 24 h. After 24 h, methylcellulose overlay was removed, cells were washed twice with PBS and fixed with 2% paraformaldehyde in PBS for 30 min at room temperature. Following fixation, plates were washed twice with PBS and foci were visualized on a fluorescence ELISPOT reader (CTL ImmunoSpot S6 Universal Analyzer) and enumerated using Viridot
. The neutralization titers were calculated as follows: 1 – (ratio of the mean number of foci in the presence of sera and foci at the highest dilution of respective sera sample). Each specimen was tested in two independent assays performed at different times. The FRNT-mNG50 titers were interpolated using a 4-parameter nonlinear regression in GraphPad Prism 8.4.3. Samples with an FRNT-mNG50 value that was below the limit of detection were plotted at 20.
Spike and RBD memory B cell flow cytometry assays
Fluorescent SARS-CoV-2-specific S6P
(provided by Roland Strong, Fred Hutchinson Cancer Research Center, Seattle, WA) and RBD (provided by Leonidas Stamatatos, Fred Hutchinson Cancer Research Center, Seattle, WA) probes were made by combining biotinylated protein with fluorescently labeled streptavidin (SA). The S6P probes were made at a ratio of 1:1 molar ratio of trimer to SA. Two S6P probes, one labeled with AlexaFluor488 (Invitrogen), one labeled with AlexaFluor647 (Invitrogen), were used in this panel in order to increase specificity of the detection of SARS-CoV-2-specific B cells. The RBD probe was prepared at a 4:1 molar ratio of RBD monomers to SA, labeled with R-phycoerythrin (Invitrogen). Cryopreserved PBMCs from SARS-CoV-2-convalescent participants and a pre-pandemic SARS-CoV-2-naive donor were thawed at 37°C and stained for SARS-CoV-2-specific memory B cells as described previously
with a panel of fluorescently-labeled antibodies (see Key Resource Table). Cells were stained first with the viability stain (Invitrogen) in PBS for 15 min at 4°C. Cells were then washed with 2% FBS/PBS and stained with a cocktail of the three probes for 30 min at 4°C. The probe cocktail was washed off with 2% FBS/PBS and the samples were stained with the remaining antibody panel and incubated for 25 min at 4°C. The cells were washed two times and resuspended in 1% paraformaldehyde/1 × PBS for collection on a LSR II or FACSymphony flow cytometer (BD Biosciences). Data was analyzed in Flow Jo version 9.9.4.
Intracellular cytokine staining (ICS) assay
Flow cytometry was used to examine SARS-CoV-2-specific CD4+ and CD8+ T cell responses using a validated ICS assay. The assay was similar to a published report
,
,
and the details of the staining panel are included in the Key Resource Table. Peptide pools covering the structural proteins of SARS-CoV-2 were used for the six-h stimulation. Peptides matching the SARS-CoV-2 spike sequence (316 peptides, plus 4 peptides covering the G614 variant) were synthesized as 15 amino acids long with 11 amino acids overlap and pooled in 2 pools (S1 and S2) for testing (BioSynthesis). All other peptides were 13 amino acids overlapping by 11 amino acids and were synthesized by GenScript. The peptides covering the envelope (E), membrane (M) and nucleocapsid (N) were initially combined into one peptide pool, but the majority of the assays were performed using a separate pool for N and one that combined only E and M. Several of the open reading frame (ORF) peptides were combined into two pools: ORF 3a and 6, and ORF 7a, 7b and 8. All peptide pools were used at a final concentration of 1 mg/mL for each peptide. As a negative control, cells were not stimulated, only the peptide diluent (DMSO) was included. As a positive control, cells were stimulated with a polyclonal stimulant, staphylococcal enterotoxin B (SEB). Cells expressing IFN-g and/or IL-2 and/or CD154 was the primary immunogenicity endpoint for CD4+ T cells and cells expressing IFN-g was the primary immunogenicity endpoint for CD8+ T cells. The overall response to SARS-CoV-2 was defined as the sum of the background-subtracted responses to each of the individual pools. A sample was considered positive for CD4+ or CD8+ T cell responses to SARS-CoV-2 if any of the CD4+ or CD8+ T cell responses to the individual peptide pool stimulations was positive. Positivity was determined using MIMOSA
. The total number of CD4+ T cells must have exceeded 10,000 and the total number of CD8+ T cells must have exceeded 5,000 for the assay data to be included in the analysis.
Quantification and statistical analysis
Binding and neutralizing antibody responses
Mixed effects exponential and power law models were used to analyze waning of antibody (day 42 to day 263 post symptom onset). For binding antibody analyses, antibody (Ab) was natural log transformed, yielding linear equations of the form ln(Ab) = a+b∗(day-42) and ln(Ab) = a+b∗ln(day/42) for the exponential and power law models, respectively, and fit using the lmer function (lme4 package) in R. Models included population level fixed effects and individual level random effects for intercept and slope and covariance between the random effects. Simplified models – with random effects only for intercept – were also fit. Neutralization antibody data were analyzed in Monolix (Lixoft). For analysis in Monolix, the exponential and power law models were formulated as ordinary differential equations, dAb/dt = k∗Ab and dAb/dt = k∗Ab/t, respectively, with antibody at day 42 lognormally distributed and lognormal multiplicative error. Neutralization titers < 20 were treated as left censored. For comparison of models, difference in Akaike information criterion (DAIC) > 4 was considered statistically significant. Models (in R and Monolix) were fit using maximum likelihood. To account for repeated-measures, correlations between antibody binding levels and neutralization titers were calculated using a repeated-measures correlation (rmcorr package) in R
.
B cell responses
We considered linear mixed effects models for B cell response, YijYij, as a function of tijtij, the jthjth time since symptom onset for the ithith individual, with random effects for intercept and slope and tijtij > 30 days for all i,ji,j:
where β0i=β0+biβ0i=β0+bi and β1i=β1+ciβ1i=β1+ci with (bi,ci)(bi,ci) iid ∼N2(0,Σ)N2(0,Σ), with
T cell responses
Longitudinal analyses of CD4+ and CD8+ T cell responses were performed for individuals with a positive response for at least one time point 30 days after symptom onset. The MIMOSA (Mixture Models for Single-Cell Assays)
model incorporated cell count and cell proportion information to define a positive CD4+/CD8+ T cell response by ICS by comparing peptide pools stimulated cells and unstimulated negative controls. This method assumed a common distribution for cytokine positive CD4+/CD8+ T cells in stimulated and unstimulated samples in non-responders, resulting in paired differences that were zero on average. In contrast, for responders, the distribution of the proportion of cytokine positive cells for stimulated samples was assumed to be greater than for unstimulated samples, resulting in paired differences that were greater than zero on average. The MIMOSA method modeled this structure through a Bayesian hierarchical mixture model framework. One component (or distribution) of the model represented the responders, and the other component modeled the non-responders. The parameters defining these distributions, as well as the probabilities that each ICS response was either a responder or non-responder, were estimated from the observed data. This sharing of information across SARS-CoV-2 responders and non-responders increased the sensitivity and specificity to make positivity calls
. Responses with probability of response > 0.999 were considered positive responders.
We considered nonlinear mixed effects models for T cell response, YijYij, as a function of tijtij, the jthjth time since symptom onset for the ithith individual, with random effects for intercept and slope and tijtij > 30 days for all i,ji,j:
where β0i=β0+biβ0i=β0+bi and exp(β1i)=exp(β1+ci)exp(β1i)=exp(β1+ci) with (bi,ci)(bi,ci) iid ∼N2(0,Σ)N2(0,Σ), with
Acknowledgments
Author contributions
Declaration of interests
Supplemental information
-
Document S1. Table S1 and Figures S1-S6
References
-
Adaptive immunity to SARS-CoV-2 and COVID-19.
Cell. 2021; 184: 861-880
-
COVID-19 and the Path to Immunity.
JAMA. 2020; 324: 1279-1281
-
Antibody Persistence through 6 Months after the Second Dose of mRNA-1273 Vaccine for Covid-19.
N. Engl. J. Med. 2021; 384: 2259-2261
-
Safety and Immunogenicity of SARS-CoV-2 mRNA-1273 Vaccine in Older Adults.
N. Engl. J. Med. 2020; 383: 2427-2438
-
Interim Results of a Phase 1-2a Trial of Ad26.COV2.S Covid-19 Vaccine.
N. Engl. J. Med. 2021; 384: 1824-1835
-
The time course of the immune response to experimental coronavirus infection of man.
Epidemiol. Infect. 1990; 105: 435-446
-
Seasonal coronavirus protective immunity is short-lasting.
Nat. Med. 2020; 26: 1691-1693
-
Immunological characteristics govern the transition of COVID-19 to endemicity.
Science. 2021; 371: 741-745
-
Humoral immunity due to long-lived plasma cells.
Immunity. 1998; 8: 363-372
-
Duration of antiviral immunity after smallpox vaccination.
Nat. Med. 2003; 9: 1131-1137
-
Lifetime of plasma cells in the bone marrow.
Nature. 1997; 388: 133-134
-
Duration of humoral immunity to common viral and vaccine antigens.
N. Engl. J. Med. 2007; 357: 1903-1915
-
Influenza vaccine-induced human bone marrow plasma cells decline within a year after vaccination.
Science. 2020; 370: 237-241
-
Decoding Covid-19 with the SARS-CoV-2 Genome.
Curr. Genet. Med. Rep. 2021; Jan 9: 1-12
-
Origin and differentiation of human memory CD8 T cells after vaccination.
Nature. 2017; 552: 362-367
-
Long-term Immune Response to Yellow Fever Vaccination in Human Immunodeficiency Virus (HIV)-Infected Individuals Depends on HIV RNA Suppression Status: Implications for Vaccination Schedule.
Clin. Infect. Dis. 2018; 66: 1099-1108
-
Structure, Function, and Antigenicity of the SARS-CoV-2 Spike Glycoprotein.
Cell. 2020; 181: 281-292
-
Human neutralizing antibodies elicited by SARS-CoV-2 infection.
Nature. 2020; 584: 115-119
-
Analysis of a SARS-CoV-2-Infected Individual Reveals Development of Potent Neutralizing Antibodies with Limited Somatic Mutation.
Immunity. 2020; 53: 98-105
-
Potently neutralizing and protective human antibodies against SARS-CoV-2.
Nature. 2020; 584: 443-449
-
Dynamics and turnover of memory CD8 T cell responses following yellow fever vaccination.
bioRxiv. 2021;https://doi.org/10.1101/2021.01.23.427919
-
Evolution of immune responses to SARS-CoV-2 in mild-moderate COVID-19.
Nat. Commun. 2021; 12: 1162
-
SARS-CoV-2 infection induces long-lived bone marrow plasma cells in humans.
Nature. 2021;https://doi.org/10.1038/s41586-021-03647-4
-
mRNA vaccination boosts cross-variant neutralizing antibodies elicited by SARS-CoV-2 infection.
Science. 2021; : eabg9175
-
Evolution of antibody immunity to SARS-CoV-2.
Nature. 2021; 591: 639-644
-
Immunological memory to SARS-CoV-2 assessed for up to 8 months after infection.
Science. 2021; 371: eabf4063
-
Functional SARS-CoV-2-Specific Immune Memory Persists after Mild COVID-19.
Cell. 2021; 184: 169-183
-
SARS-CoV-2 Viral Variants-Tackling a Moving Target.
JAMA. 2021; 325: 1261-1262
-
Infection- and vaccine-induced antibody binding and neutralization of the B.1.351 SARS-CoV-2 variant.
Cell Host Microbe. 2021; 29: 516-521
-
Characteristics of and Important Lessons From the Coronavirus Disease 2019 (COVID-19) Outbreak in China: Summary of a Report of 72 314 Cases From the Chinese Center for Disease Control and Prevention.
JAMA. 2020; 323: 1239-1242
-
Defining antigen-specific plasmablast and memory B cell subsets in human blood after viral infection or vaccination.
Nat. Immunol. 2016; 17: 1226-1234
-
Cross-Network PBMC Processing SOP v6.0.
HIV/AIDS Network Coordination (HANC), 2018https://doi.org/10.1016/j.jim.2014.03.024(https://doi.org/)
-
An Infectious cDNA Clone of SARS-CoV-2.
Cell Host Microbe. 2020; 27: 841-848
-
Development of a Rapid Focus Reduction Neutralization Test Assay for Measuring SARS-CoV-2 Neutralizing Antibodies.
Curr. Protoc. Immunol. 2020; 131: e116
-
Rapid Generation of Neutralizing Antibody Responses in COVID-19 Patients.
Cell Rep Med. 2020; 1: 100040
-
Viridot: An automated virus plaque (immunofocus) counter for the measurement of serological neutralizing responses with application to dengue virus.
PLoS Negl. Trop. Dis. 2018; 12: e0006862
-
Structure-based design of prefusion-stabilized SARS-CoV-2 spikes.
Science. 2020; 369: 1501-1505
-
OMIP-056: Evaluation of Human Conventional T Cells, Donor-Unrestricted T Cells, and NK Cells Including Memory Phenotype by Intracellular Cytokine Staining.
Cytometry A. 2019; 95: 722-725
-
Optimization and validation of an 8-color intracellular cytokine staining (ICS) assay to quantify antigen-specific T cells induced by vaccination.
J. Immunol. Methods. 2007; 323: 39-54
-
Mixture models for single-cell assays with applications to vaccine studies.
Biostatistics. 2014; 15: 87-101
-
Repeated Measures Correlation.
Front. Psychol. 2017; 8: 456
-
Detecting differential gene expression with a semiparametric hierarchical mixture method.
Biostatistics. 2004; 5: 155-176
Article Info
Publication History
Identification
Copyright
User License
Creative Commons Attribution – NonCommercial – NoDerivs (CC BY-NC-ND 4.0) |

ScienceDirect
Figures
-
 Graphical Abstract
 -
Figure 1Longitudinal SARS-CoV-2 spike-binding antibody responses
-
Figure 2Longitudinal binding antibody responses to other coronavirus spike proteins
-
Figure 3Neutralizing antibody responses to SARS-CoV-2
-
Figure 4SARS-CoV-2 spike and RBD-specific memory B cells
-
 Figure 5CD4+ T cell responses to SARS-CoV-2 antigens
 -
 Figure 6CD8+ T cell responses to SARS-COV-2 antigens
 -
Figure 7Correlations between SARS-CoV-2-specific immune responses and assessment of covariates

00203-2&id=fx1.jpg)
00203-2&id=gr1.jpg)
00203-2&id=gr2.jpg)
00203-2&id=gr3.jpg)
00203-2&id=gr4.jpg)
00203-2&id=gr5.jpg)
00203-2&id=gr6.jpg)
00203-2&id=gr7.jpg)