
People who’ve received four doses or more are around 100 times more likely to be hospitalized than those who are unvaccinated against COVID-19.
Fri Jul 29, 2022
(Paul Alexander) – This U.K. and New South Wales Australia data is alarming as to the risks faced by the COVID jab boosted population for hospitalization and death (post shot).
The fraud started when the Centers for Disease Control and Prevention (CDC), the National Institutes for Health (NIH), and World Health Organization (WHO), along with public health leaders like Anthony Fauci and Francis Collins and Rochelle Walensky, came up with the master deceit, whereby they redefined what it meant to be “vaccinated.”
You had to be 14–15 days post shot, and have taken multiple doses. In other words, all those infections, hospitalizations, and deaths that occurred from day one all the way to day fifteen post shot were counted as being “unvaccinated.” And these beasts were then able to go on the media and say “this is a pandemic of the unvaccinated” to drive fear and for you to rush to be vaccinated knowing full well that they were shilling for a fake, failed, ineffective, dangerous injection.
Check out the official data for England from the Office for National Statistics (ONS) and you’ll see clear evidence for why you need to get your jabs “up-to-date.”
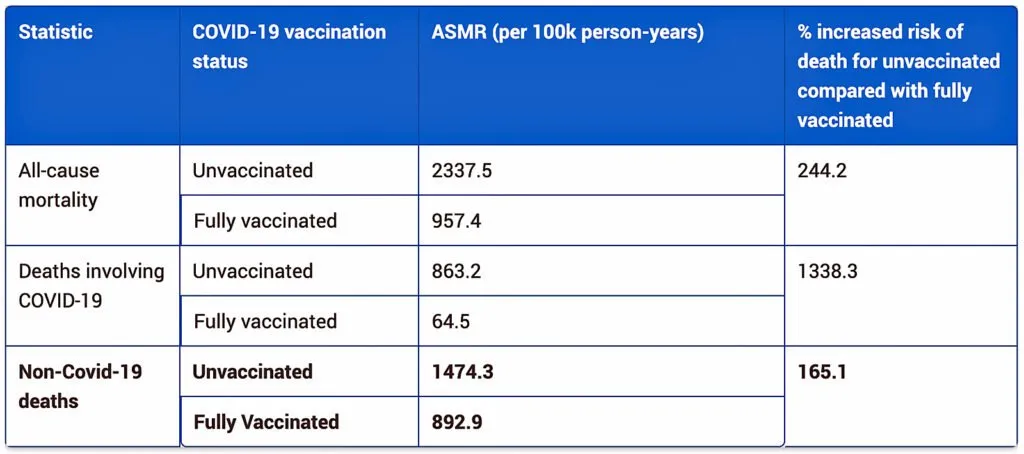
You’ll be over 13 times less likely to die from conditions involving COVID-19. Your all-cause mortality risks, even, will be around two and a half times lower if you’re fully jabbed – isn’t that something of a bonus?
Office for manipulated statistics
For the data-hungry among you, it’s all there in Table 3 from the latest edition of the “Deaths by vaccination status, England” dataset, courtesy of the ONS’s National Immunisation Management Service.
Look beneath the surface of these data and you’ll find a problem, however. A fatal problem.
The same dataset also tells you that you’ll be 65 percent more likely to die from non-COVID-19 deaths if your jabs are fully up-to-date, compared with being unvaccinated. But that simply can’t be. You can’t be that much more likely to die from non-COVID-19 causes unless you make it appear that way because your numbers got jumbled, either deliberately or accidentally, along the way.
This one faulty statistic stands as a stark reminder that all the ONS data for England – that are relied on well beyond the territorial boundaries of England and even the U.K. – are flawed. That in turn means that data which might have convinced you or your loved ones to roll up their sleeves is wrong. Plain and simple.
This latter point on non-COVID-19 deaths has been drawn to our attention by none other than Norman Fenton and Martin Neil, professors from Queen Mary University of London.
We’ve gone back to the original data that includes the latest edition of the dataset that takes in the entire period of U.K. vaccination from January 2021 through May 2022, in Table 3 of the ONS dataset, and we’ve summarized it in Table 1 (see below).
The non-COVID-19 mortality data is indicated in bold to remind you of its impossibility and that makes the rest of the data flawed too because COVID-19 and non-COVID-19 mortality data are not independent of each other.
Professors Fenton and Neil have previously explained, here and here, how these data were corrupted. They now also show that the figure of 1,474 deaths per 100,000 person-years has been massively bumped up from those in recent history, looking more or less on par with those of the fully vaccinated (see the second table in Fenton and Neil’s latest article).
One wonders how the public would have responded had the misallocations occurred in the opposite direction. In fact, we know how they’d respond – and so do those responsible for implementing or ignoring the data manipulation.
Down under
Now let’s leapfrog across our beautiful, yet humanity-stressed, blue planet, from England to New South Wales (NSW), Australia, a part of the world that I was fortunate to be able to call home for over a decade.
With over 95 percent of the NSW population having received at least one jab, Brad Hazzard, NSW health minister, has slammed the over 30 percent of the 8 million people of NSW saying they need to “wake up,” “switch off…social media and switch on reality” and stop being so selfish.
The number of people in NSW hospitals with COVID-19 is clearly on the rise, moving toward the second highest peak since the start of the year (see figure below). Is it those infernal unvaccinated causing the problem again?
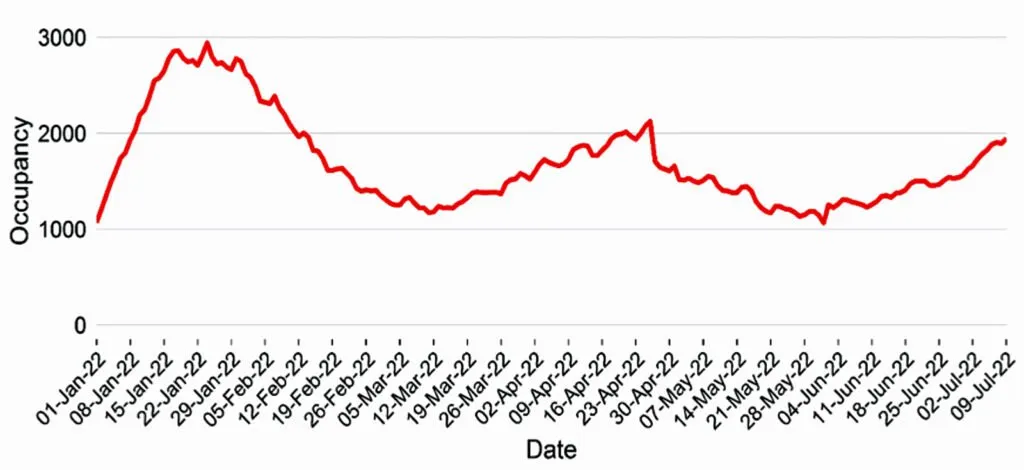
Well, yes, it would seem this is the official line. The latest surveillance report suggests the new waves of BA.4 and BA.5 Omicron subvariants are responsible, highlighting the recent upward trend that includes a 17 percent increase in hospitalizations (1,658 to 1,946) in the first week of July.
The big message is the same as in England: go get jabbed.
Take this statement from the surveillance report, for example:
“Of the 95 people who were reported to have died with COVID-19, all were eligible for a third dose of a COVID-19 vaccine but only 62 (65% of those eligible) had received a third dose.”
You can find contrary messages in the same report if you look for them.
Take this passage that reminds us that none of the six people under 65 who died from COVID-19 were either healthy or unvaccinated:
“Six people aged under 65 years died with COVID-19. All six cases had records of significant underlying health conditions that increase the risk of severe disease from COVID-19 … Four of these cases had received 3 doses of a vaccine … Two of these cases had received 2 doses of a vaccine.”
Digging beneath the surface reveals more problems with the official rhetoric.
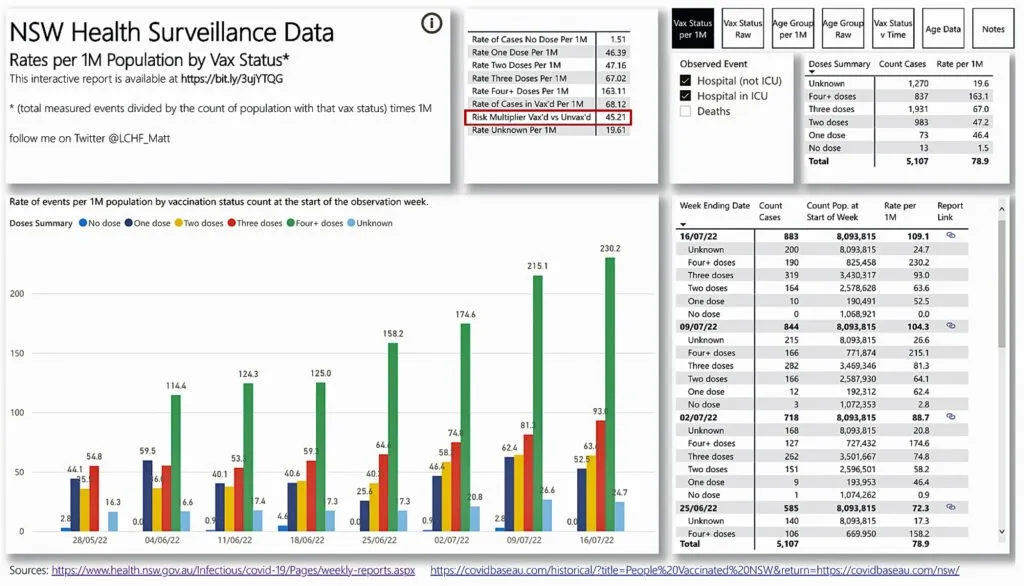
The official NSW data from the last seven weeks – when NSW is meant to be grappling with the “super-contagious” BA.4 and BA.5 omicron subvariants – shows that people who had been vaccinated one (minimum) to four (maximum) times against COVID-19 were 45 times more likely to be hospitalized than if they were unvaccinated.
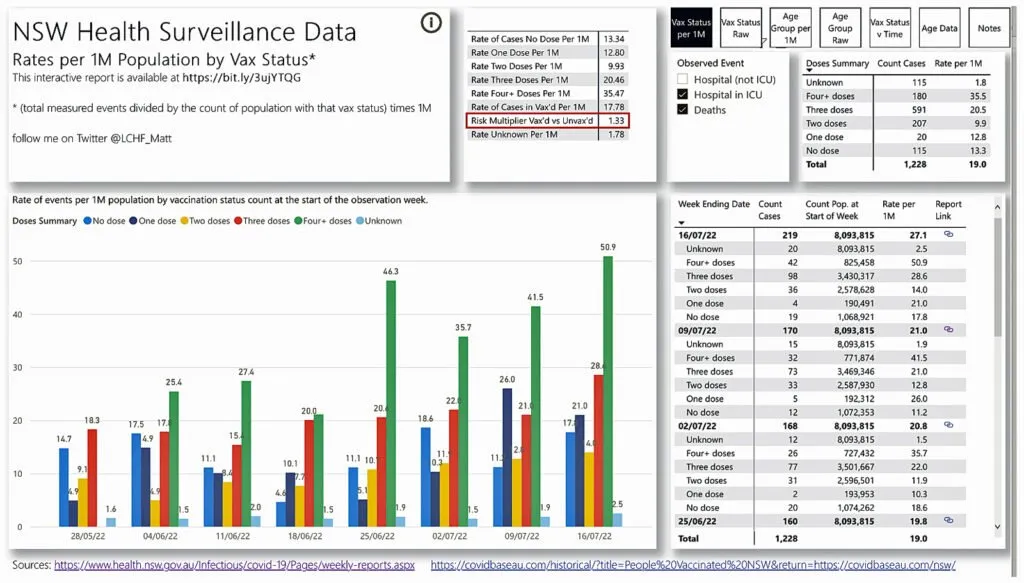
This was brought to our attention by Joel Smalley, analyst, in a July 19 Substack post. Joel links to a powerful interactive app that allows anyone to play with the official NSW data on hospitalizations and deaths.
So this (Figure 2 below) is what the last seven weeks of data look like, in terms of hospitalizations (both ICU and non-ICU). The tall green bars show us hospitalization from four or more doses of COVID-19 ‘vaccines’, while the first bar in each time series (mid-blue) shows us the hospitalizations among the unvaccinated.
The data are standardized per 1 million population so we remove bias, given that so many are vaccinated with one or more doses, and so few are not. You don’t need to be a rocket scientist to see the mid-blue “no dose” bars are relatively unchanged over the last six weeks and the green bars are going skyward.
It’s some of the most interesting data we’ve seen so far pointing to a dose-response issue – the more doses, the more vulnerable you are to hospitalization. Not what the NSW government is telling the public, despite this being their own data.
Of course, we’re dealing with a moving target. The same official NSW government data source during the earlier delta-phase of 2021 showed a different picture, captured by Reuters last November. Back then, the NSW data suggested the unvaccinated were 16 times more likely to end up in intensive care units or die.
The official NSW data over the last seven weeks, in which omicron has been displacing delta, show a different picture as revealed by the data we show in Figure 2.
When we select just ICU hospitalizations and deaths – to allow comparison with the 16-fold statistic cited by Reuters last November – we now find you’re 31 percent more likely to go into intensive care or die if you’re unvaccinated, as you can see in Figure 3 (red rectangle).
But Hazzard and myriad other public health officials are silent on this. One wonders (or rather knows) why.
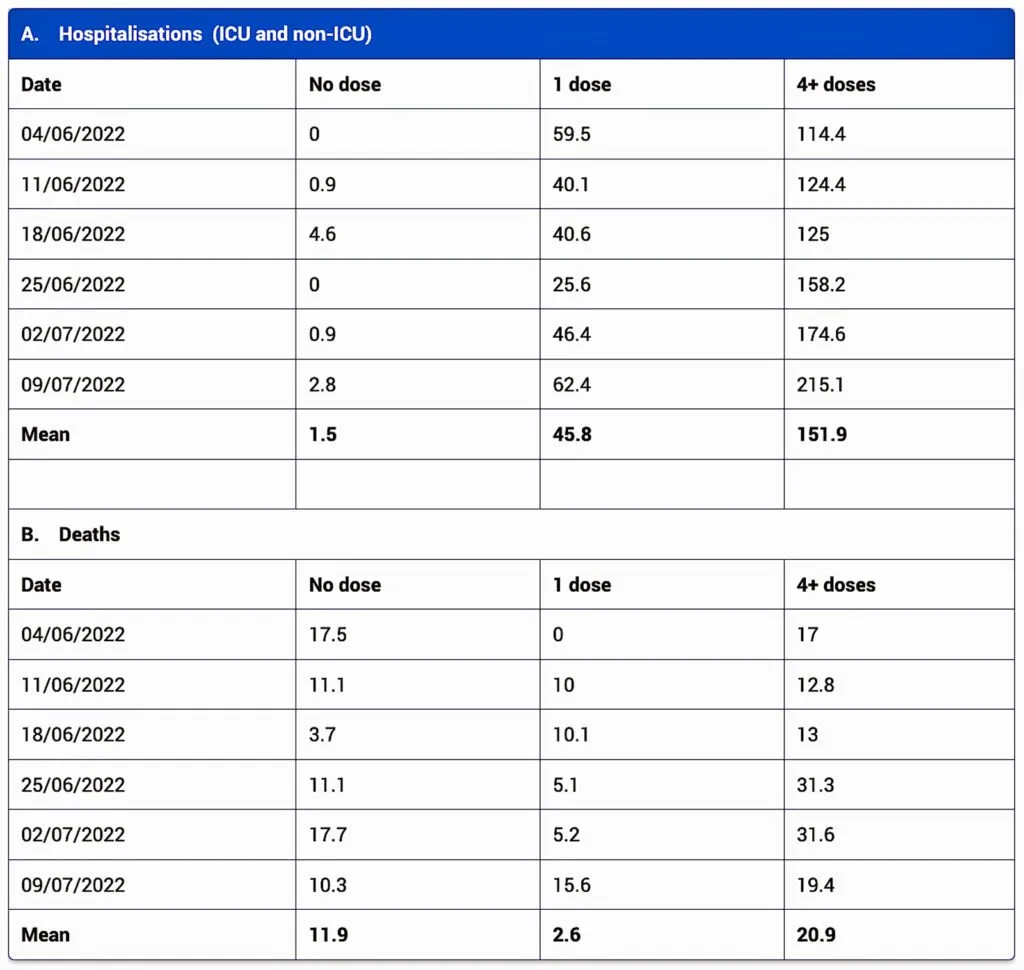
It gets worse when you compare the extreme ends of the official NSW dose-response data: the unvaccinated versus those vaccinated with four or more doses.
We’ve done this in Table 2:
Take-homes
The take-homes are staring us in the face. Whether you look at hospitalizations or deaths, those who are vaccinated with four or more doses are the worst off.
People who’ve received four doses or more are around 100 times more likely to be hospitalized than those who are unvaccinated.
This difference is a massive two orders of magnitude that is likely to include a hefty (read: real) signal regardless of how dirty the underlying data are. We also see what appears to be a clear dose-response – the more doses, the more likely you are to be hospitalized.
The mortality data aren’t as clear, because the one-dose recipients appear the best off. This may be real, or it may be anomalous, bearing in mind the difference is less than one order of magnitude.
But should we ignore the difference between deaths among the unvaccinated and the ones injected four or more times? There are 1.75-fold more deaths among those with four plus COVID-19 injections compared with those unvaccinated.
However you choose to interpret these data, it’s impossible to use them to suggest that people who’ve had four jabs are better off than those who are unvaccinated.
Nor are there any reliable data to suggest this is now a pandemic of the unvaccinated.
A pandemic of the heavily boosted
It seems the official NSW data already tell us the opposite: this is rapidly becoming a “pandemic of the vaccinated.” The risks to this group of course go well beyond just COVID-19.
The public is just not being informed of the reality – and public health authorities continue to beat the same drum using a defective narrative. The English data appear different on the surface, but there is clear evidence of data manipulation.
Even the emerging science is beginning to explain why an ever greater number of COVID-19 jabs is likely to contribute to greater risks for recipients. Possible mechanisms include innate immune erosion, original antigenic sin, and T-cell dysregulation.
Many of us are coming to the conclusion that we’re living through the greatest ever manipulation of science, given the sheer number of people involved.
Anyone who still buys into the idea we can still vaccinate ourselves out of this surreal construct we have learned to call a “pandemic” is likely to benefit from taking a close look at the English and NSW data discussed here, data that have been held in great esteem by authorities around the world.
Time to take a reality check. Or can you turn a blind eye and accept the same reality Brad Hazzard talks of, in the belief that more and more COVID-19 vaccination will be the solution to COVID-19 and “regaining normality.”
Reprinted with permission from Paul Alexander.
