
Key Points:
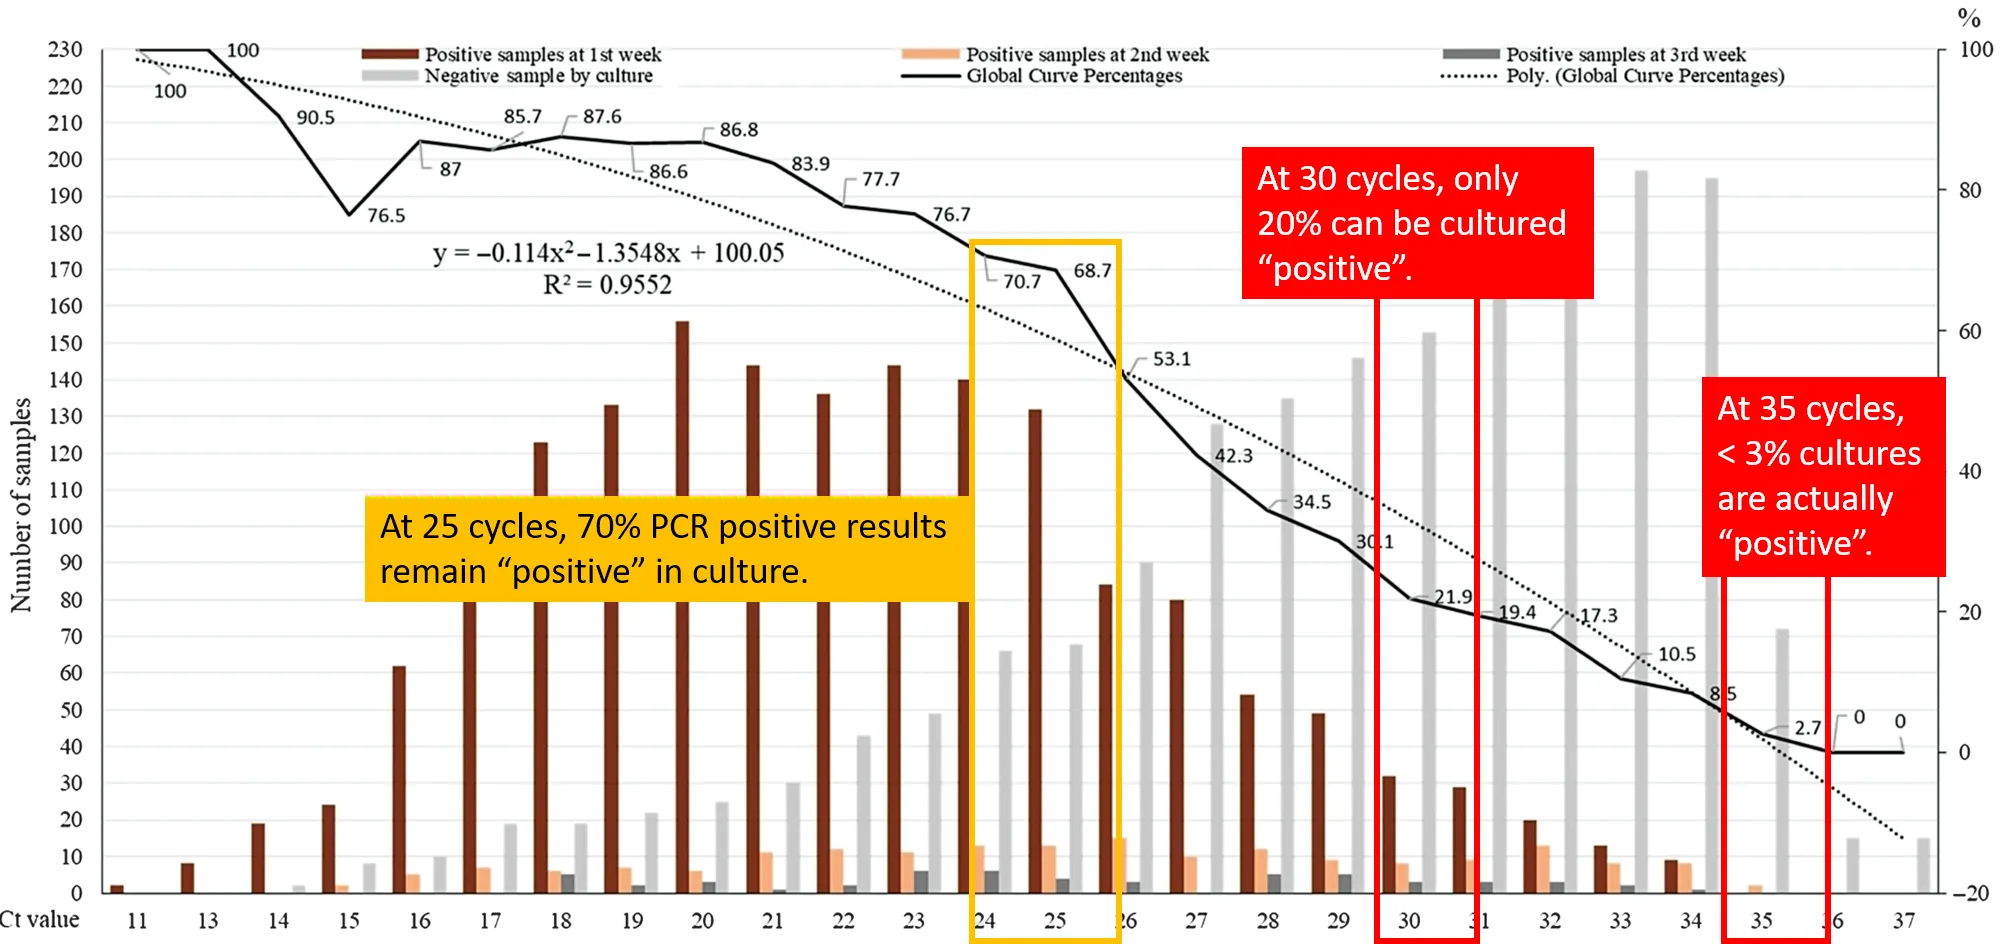
- It can be observed that at Ct = 25, up to 70% of patients remain positive in culture.
- At Ct = 30 this value drops to 20%.
- At Ct = 35, the value we used to report a positive result for PCR, <3% of cultures are positive.
PDF:
Extract
TO THE EDITOR—The outbreak of the coronavirus disease 2019 (COVID-19) pandemic due to severe acute respiratory syndrome coronavirus 2 (SARS-CoV-2) was declared a pandemic on 12 March 2020 by the World Health Organization [1]. A major issue related to the outbreak has been to correlate viral RNA load obtained after reverse-transcription polymerase chain reaction (RT-PCR) and expressed as the cycle threshold (Ct) with contagiousness and therefore duration of eviction from contacts and discharge from specialized infectious disease wards. Several recent publications, based on more than 100 studies, have attempted to propose a cutoff Ct value and duration of eviction, with a consensus at approximately Ct >30 and at least 10 days, respectively [2–5]. However, in an article published in Clinical Infectious Diseases, Bullard et al reported that patients could not be contagious with Ct >25 as the virus is not detected in culture above this value [6]. This limit was then evoked in the French media during an interview with a member of the French Scientific Council Covid-19 as a possible value above which patients are no longer contagious [7].
At the beginning of the outbreak, we correlated Ct values obtained using our PCR technique based on amplification of the E gene and the results of the culture [8]. Since the beginning of the pandemic, we have performed 250 566 SARS-CoV-2 RT-PCR for 179 151 patients, of whom 13 161 (7.3%) tested positive. Up to the end of May, 3790 of these samples, reported as positive on nasopharyngeal samples, were inoculated and managed for culture as previously described [8]. Of these 3790 inoculated samples, 1941 SARS-CoV-2 isolates could be obtained after the first inoculation or up to 2 blind subcultures. The correlation between the scanner values and the positivity of the culture allows us to observe that the image obtained with 10 times more isolates than in our preliminary work (1941 vs 129) does not change significantly (Figure 1). It can be observed that at Ct = 25, up to 70% of patients remain positive in culture and that at Ct = 30 this value drops to 20%. At Ct = 35, the value we used to report a positive result for PCR, <3% of cultures are positive. Our Ct value of 35, initially based on the results obtained by RT-PCR on control negative samples in our laboratory and initial results of cultures [8], is validated by the results herein presented and is in correlation with what was proposed in Korea [9] and Taiwan [10]. We could observe that subcultures, especially the first one, allow an increasing percentage of viral isolation in samples with Ct values, confirming that these high Ct values are mostly correlated with low viral loads. From our cohort, we now need to try to understand and define the duration and frequency of live virus shedding in patients on a case-by-case basis in the rare cases when the PCR is positive beyond 10 days, often at a Ct >30. In any cases, these rare cases should not impact public health decisions.

Percentage of positive viral cultures of severe acute respiratory syndrome coronavirus 2 polymerase chain reaction–positive nasopharyngeal samples from coronavirus disease 2019 patients, according to Ct value (plain line). The dashed curve indicates the polynomial regression curve. Abbreviations: Ct, cycle threshold; Poly., polynomial.
Notes
Ethical approval. The protocol was approved by the University Hospital Institute Méditerranée Infection Ethical Committee. All patients provided informed consent in accordance with the Declaration of Helsinki.
Financial support. This research was funded by the French Government under the Investissements d’avenir (Investments for the Future) program managed by the Agence Nationale de la Recherche (French National Agency for Research; reference: Méditerranée Infection 10-IAHU-03) and by Région Provence-Alpes-Côte d’Azur and European funding Fond Europen de Recheche et de developpement (FEDER) PRIMI.
Potential conflicts of interest. D. R. reports grants from the Hitachi High-Tech Corporation outside the submitted work. All other authors report no potential conflicts. All authors have submitted the ICMJE Form for Disclosure of Potential Conflicts of Interest. Conflicts that the editors consider relevant to the content of the manuscript have been disclosed.
References
1.
.
—
. Available at: https://www.who.int/dg/speeches/detail/who-director-general-s-opening-remarks-at-the-media-briefing-on-covid-19—11-march-2020.
.
2.
,
,
,
.
.
:
.
3.
,
,
,
.
; doi:10.1093/cid/ciaa1249.
4.
,
,
, et al.
.
;
:
5.
,
,
,
,
,
.
.
. doi: 10.1101/2020.07.25.20162107.
6.
,
,
, et al.
.
; doi:10.1093/cid/ciaa638.
7.
.
.
. Available at: https://www.lemonde.fr/les-decodeurs/article/2020/09/09/covid-19-l-hypersensibilite-des-tests-pcr-entre-intox-et-vrai-debat_6051528_4355770.html.
.
8.
,
,
, et al.
.
;
:
–
.
9.
,
,
.
.
. doi:10.1097/PHM.0000000000001471.
10.
,
,
, et al.
.
;
:
.
