https://www.cdc.gov/library/covid19/070720_covidupdate.html
Updated February 22, 2021

From the Office of the Chief Medical Officer, CDC COVID-19 Response, and the CDC Library, Atlanta GA. Intended for use by public health professionals responding to the COVID-19 pandemic.
*** Available on-line at http://www.cdc.gov/library/covid19 ***
Here you can find all previous COVID-19 Science Updates.
PEER-REVIEWED
Community use of face masks and COVID-19: Evidence from a natural experiment of state mandates in the USexternal icon. Lyu et al. Health Affairs (June 16, 2020).
Key findings:
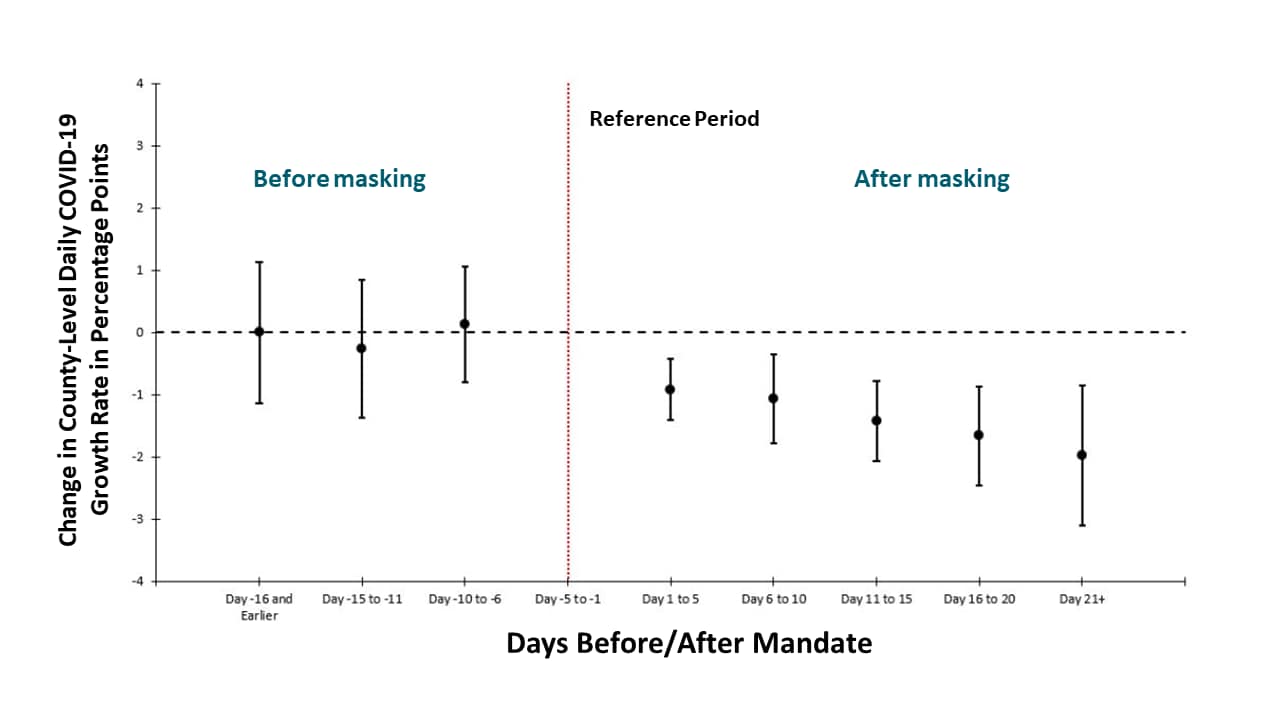
- Daily COVID-19 growth rates declined following mandated state-level public face coverings (Figure).
- Mandated public face coverings may have averted 230,000–450,000 COVID-19 cases.
Methods: Event study examining changes in the daily county-level COVID-19 growth rates in 15 states plus DC that issued facemask mandates, between March 31 and May 22, 2020. The effects are shown over five-day periods before and the reference period of five days before signing the mandate. Limitations: Did not measure facemask use in the community (compliance with mandate); county-level mandates not included.
Implications: Mandated public face covering may reduce COVID-19 spread and be a useful mitigation measure.
Figure:
Note: Adapted from Lyu et al. Mandating facemasks is associated with subsequent declines in daily county-level COVID-19 growth rates (•) and 95% CIs. Growth rates (as percentage points) = log of cumulative cases on given day – log of cumulative cases on prior day. Vertical red line indicates the reference period of 5 days before the signing of the mandate. The model controls for major COVID-19 mitigation policies as time-varying (closure of K-12 schools, county-level or statewide shelter-in-place orders, non-essential business closure, closure of restaurant for dining in, closure of gyms or movies theaters), COVID-19 tests per 100,000, county fixed effects and day fixed effects. Used by permission from publisher.
Visualizing the effectiveness of face masks in obstructing respiratory jetsexternal icon. Verma et al. Physics of Fluids (June 30, 2020).
Key findings:
- Simulated heavy cough from a manikin produced particles that traveled on average ~8 feet (~96 inches)
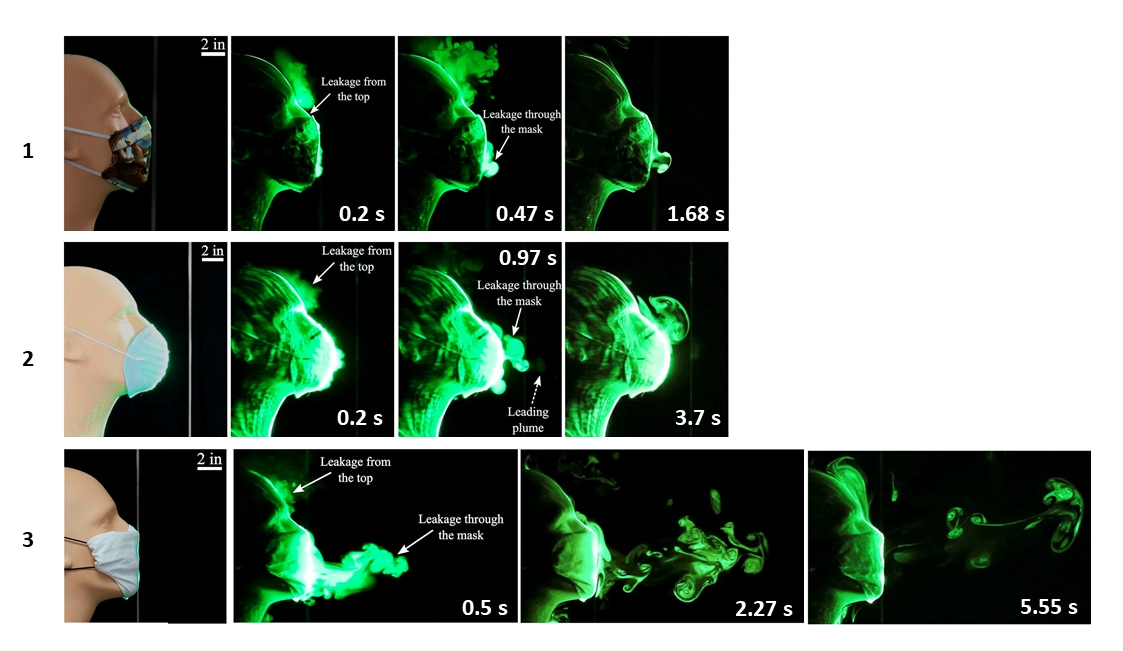
- Homemade (2-layer) cotton masks, off-the-shelf CVS® cone masks and folded handkerchiefs limited droplet spread to 2.5 inches, 8 inches and 15 inches, respectively (Figures 1-3).
- A single layer bandana-style covering of elastic T-shirt material reduced droplet spread to 43 inches.
Methods: Assessment and visualizations of a manikin’s artificial coughs and sneezes to examine how face coverings blocked particle-laden respiratory jets (“fog”) in which particles were ~1 μm to 10 μm. Limitations: Small sample size; artificial environment; unclear number of experiments and result variability.
Implications: Two-layer cotton homemade face coverings effectively limited droplet spread; folded handkerchiefs and bandanas did not.
Figure:
Note: Adapted from Verma et al. Visualization of respiratory jets after artificial coughs using three different face coverings. (1) A homemade two-layer cotton quilting fabric facemask at 0.2 s, 0.47 s, and 1.68 s. (2) An off-the-shelf cone style mask at 0.2 s, 0.97 s, and 3.7 s. (3) A folded handkerchief face mask at 0.5 s, 2.27 s, and 5.55 s. Licensed under CC-BY 4.0.
PEER-REVIEWED
Seroprevalence of anti-SARS-CoV-2 IgG antibodies in Geneva, Switzerland (SEROCoV-POP): a population-based studyexternal icon. Stringhini et al. Lancet (June 30, 2020).
Key findings:
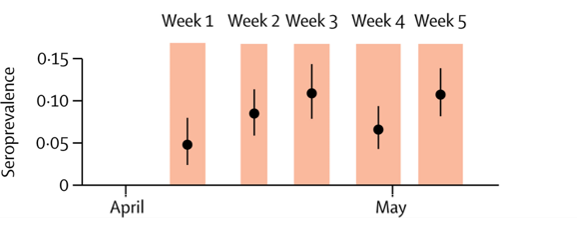
- Among 2,766 participants from 1,339 households in Geneva, weekly estimated SARS-CoV-2 seroprevalence increased from 4.8% (95% CI 2.4–0%) to 10.8% (8.2–13.9%) (Figure 1).
- Seroprevalences estimated 11.6 infections for every 1 reported confirmed case.
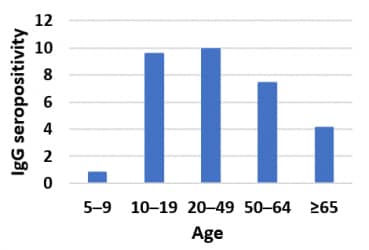
- Individuals aged 5–9 years and ≥ 65 years had lower risks of being seropositive than those 10–64 years of age (Figure 2).
Methods: Five consecutive weekly serosurveys (IgG by ELISA) of participants of annual representative study and their households, Geneva, between April 6 and May 9, 2020. Prevalence rates adjusted for sampling, test performance. Limitations: Relatively low response rate (30–40%); possible that those with COVID-19 were more likely to participate.
Implications: Young children appear to have been less often infected than adults in Geneva during the SARS-CoV-2 outbreak.
Note: Adapted from Stringhini et al. Figure 1. IgG seroprevalence estimates (black dots) and 95% CIs (black lines) for each week of the survey. Orange shading indicates each survey week. Figure 2. IgG seroprevalence by age group. This article was published in Lancet, Vol 396, Stringhini et al., Seroprevalence of anti-SARS-CoV-2 IgG antibodies in Geneva, Switzerland (SEROCoV-POP): a population-based study, Page 313-319, Copyright Elsevier 2020. This article is currently available at the Elsevier COVID-19 resource center: https://www.elsevier.com/connect/coronavirus-information-centerexternal icon.
COVID-19 in children and adolescents in Europe: a multinational, multicentre cohort studyexternal icon. Götzinger. et al. Lancet Child & Adolescent Health (June 25, 2020).
Key findings:
- Of 582 children and adolescents with SARS-CoV-2 infections, 490 (84%) were symptomatic.
- 379 (65%) had fever, 313 (54%) had mild URI symptoms.
- 363 (62%) were hospitalized; 48 (8%) required intensive care; 4 died.
- ICU admission was more common among children age < 1 month (aOR 5.1, 95% CI 1.7–14.9) and with pre-existing conditions (aOR 3.3, 95% 1.7–6.4).
- 5 (1%) were co-infected with influenza (outcome data on these children not reported).
Methods: Description of children and adolescents with SARS-CoV-2 infection, 77 institutions in 21 European countries, between April 1 and 24, 2020. Limitations: SARS-CoV-2 testing criteria differed by country; symptomatic disease might be overestimated as study captured data from children and adolescents who were seen or managed in a hospital setting.
Implications: SARS-CoV-2 infection was relatively mild in these European children and adolescents. Severe disease was associated with very young age (<1 month of age) and pre-existing medical conditions.
PEER-REVIEWED
Risk for severe COVID-19 illness among health care workers who work directly with patientsexternal icon. Gibson et al. Journal of General Internal Medicine (June 24, 2020).
Key findings:
- Among a sample of US healthcare workers (HCWs), 38.6% were deemed at high risk for poor outcomes if infected with SARS-CoV-2 (age ≥65 years or medical comorbidities).
- 0% worked in hospitals or nursing homes.
- 6% of health aides/medical assistants (HA/MAs) were deemed at high risk.
- Many HA/MAs were also financially vulnerable: 36.9% had an income <200% of federal poverty line; 26.6% were worried about food running out.
Methods: Analysis of 1,184 HCWs from nationally representative survey of 52,159 adults, National Health Interview Survey, 2017–2018. Limitations: Assumes 2017–2018 data still applicable.
Implications: A large proportion of HCWs are vulnerable to severe illness from SARS-CoV-2 infection, including many working in high-exposure risk settings. Healthcare institutions should consider HCWs with at-risk chronic conditions when developing health protection approaches and assigning duties.
Disparities in COVID-19 testing and positivity in New York Cityexternal icon. Lieberman-Cribbin et al. American Journal of Preventive Medicine (June 25, 2020).
Key findings:
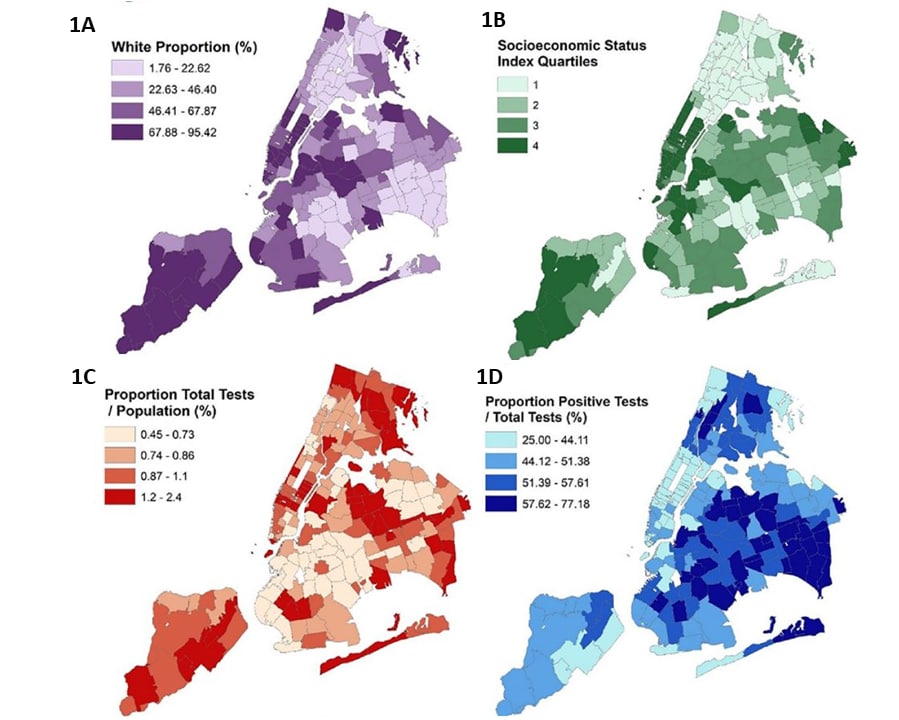
- In areas of New York City with higher proportions of non-white residents (1A) and with lower socioeconomic status (SES) (1B)
- Rates of testing were lower (Figure 1C), but
- Test positivity was higher (Figure 1D).
Methods: Ecological spatial analysis of testing volume and 2018 sociodemographic data, NYC, March 2–April 6, 2020. Associations adjusted for zip code, racial/ethnic composition, and SES. Limitations: Non-citizens likely under-represented in census data; individual-level factors not examined.
Implications: SARS-CoV-2 testing access has not been evenly distributed in NYC. Limited testing access in some communities may compound racial/ethnic disparities.
Figure:
Note: Adapted from Lieberman-Cribbin et al. Spatial distribution of testing and sociodemographic data mapped according to zip code area, NYC. Maps display the (A) proportion of white race, (B) socioeconomic status (SES) index, (C) proportion of total tests to population (%) and (D) positive tests to total tests (%). Proportion of total tests to population (%) is displayed in hundreds of residents. Darker shading indicates a greater percentage or a higher quartile (for SES index). This article was published in American Journal of Preventive Medicine, Vol 59, Lieberman-Cribbin et al., Disparities in COVID-19 testing and positivity in New York City, Page 326-332, Copyright American Journal of Preventive Medicine 2020. This article is currently available at the Elsevier COVID-19 resource center: https://www.elsevier.com/connect/coronavirus-information-centerexternal icon.
COVID-19 outcomes among people with intellectual and developmental disability living in residential group homes in New York Statepdf iconexternal icon. Landes et al. Disability and Health Journal (June 30, 2020).
Key findings:
- Rates of COVID-19 infection and mortality were more than 4 times higher among people with intellectual and developmental disabilities (IDD) living in group homes than in the New York State general population.
- Cases – 7,841 vs 1,901 cases per 100,000 population.
- Deaths – 1,175 vs 151 cases per 100,000 population.
- Rates of COVID-19 infection among IDD were highest in NYC and Mid-Hudson area of New York: 12,760 and 12,898 per 100,000, respectively.
Methods: Analysis of COVID-19 case rates and mortality among people with IDD living in NY residential group homes and among New York State general population through May 28, 2020. Limitations: Asymptomatic cases likely not well captured; ~half of group homes reported.
Implications: People with IDD living in congregate settings are at high risk of COVID-19 and poor outcomes.
Effect of environmental conditions on SARS-CoV-2 stability in human nasal mucus and sputum. Matson et al. Emerging Infectious Diseases (June 8, 2020).
Key findings:
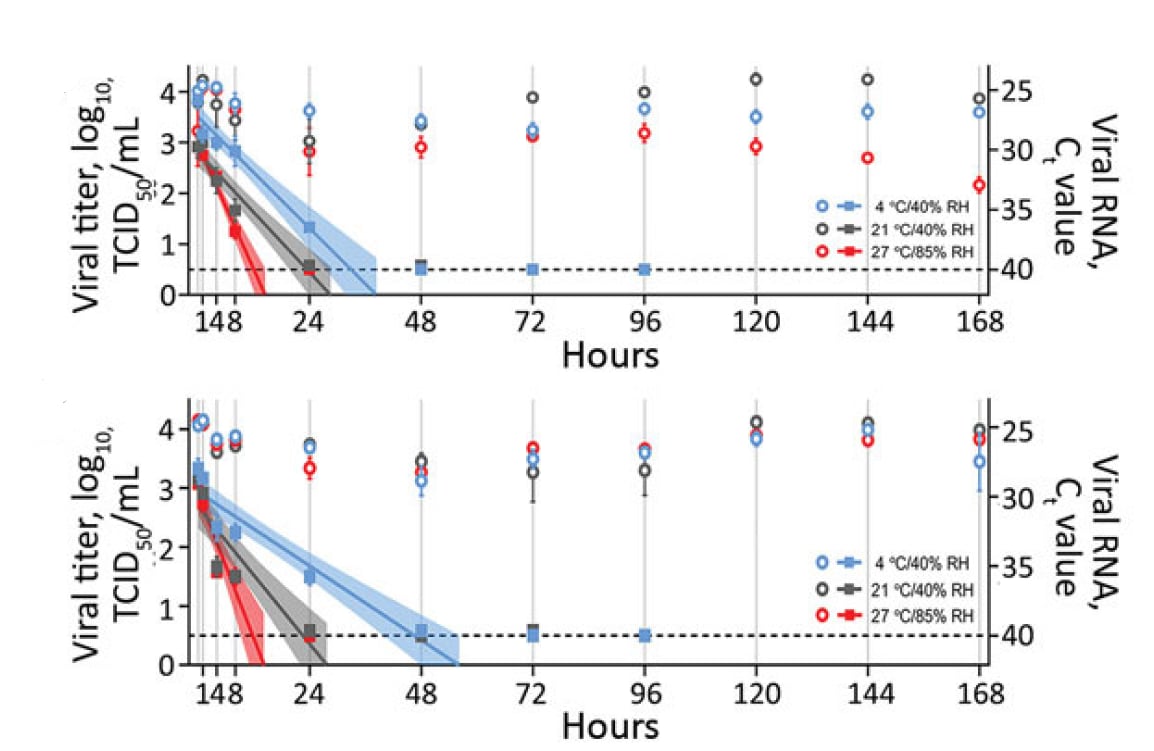
- Half-life (t1/2) of SARS-CoV-2 RNA in upper respiratory secretions varied with temperature and humidity (Figure):
- In nasal mucus on a surface, t1/2 was 3.3 hours at 4°C/40% relative humidity (RH) vs. 1.5 hours at 27°C/85% RH.
- In sputum on a surface, t1/2 was 5.8 hours at 4°C/40% RH vs. 1.5 hours at 27°C/85% RH.
Methods: t1/2 of SARS-CoV-2 RNA human nasal mucus and sputum was measured in liquid and after application on surface under three environmental conditions: 4°C/40% RH; 21°C/40% RH; and 27°C/85% RH. Limitations: Conducted under artificial laboratory conditions; detection of presence of SAR-CoV-2 RNA does not imply infectivity.
Implications: SARS-CoV-2 RNA decays faster on surfaces at warm temperatures with higher relative humidity. Culture studies might help discern the presence of infectious virus.
Figure:
Note: Adapted from Matson et al. t1/2of SARS-CoV-RNA in spiked nasal secretions (top) and sputum (bottom) dispersed on a polypropylene disk at different temperatures and humidities (4°C/40% RH; 21°C/40% RH; and 27°C/85% RH). The squares correspond to viral titer on the left y-axis, and the circles correspond to viral RNA (Ct value) on the right y-axis. Samples were collected at 0, 1, 4, 8, and 24 hours, then daily for 7 days. Viral titers were fitted with linear regression models, including 95% CIs (shaded area around lines of best fit). For both viral titers and Ct values, plots show means of 3 replicates with standard errors. Ct, cycle threshold; RH, relative humidity; TCID50/mL, 50% tissue culture infective dose/mL. Open access journal; all content freely available.
PREPRINTS (NOT PEER-REVIEWED)
Seroconversion of a city: Longitudinal monitoring of SARS-CoV-2 seroprevalence in New York Cityexternal icon. Stadlbauer et al. medRxiv (June 29, 2020). Updated analysis publishedexternal icon in Nature (November 3, 2020).
Key findings:
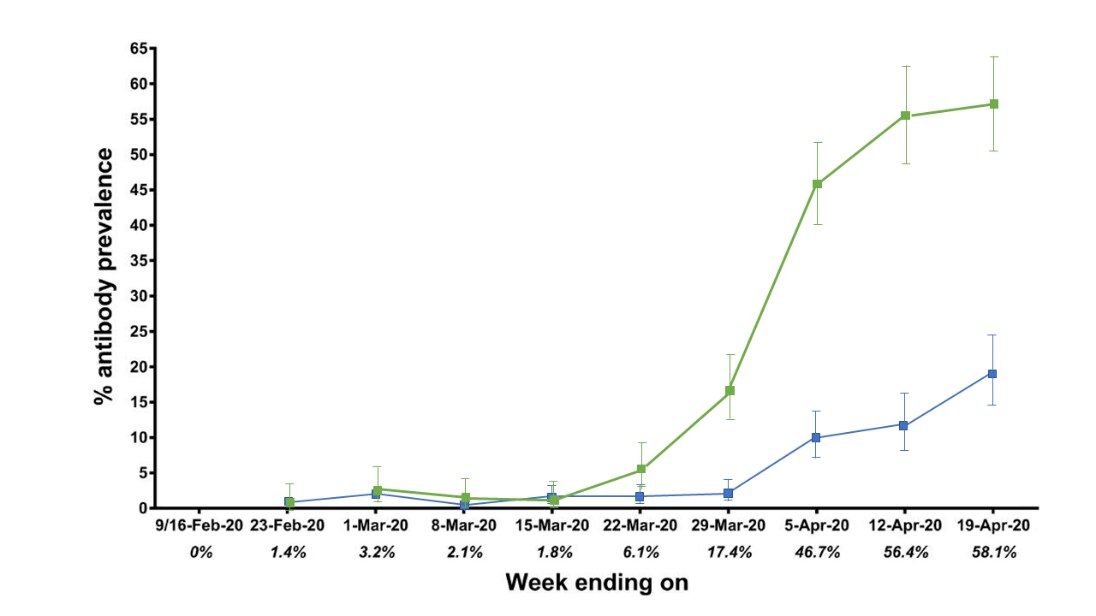
- Seroprevalence among emergency department (ED) and hospitalized patients reached 58% by April 19 (Figure).
- Seroprevalence among patients from other clinical settings reached 19.3% by April 19, 2020 (Figure).
- Earliest seropositive samples were collected February 23, 2020.
Methods: Weekly SARS-CoV-2 seroprevalence in samples from 2,073 ED and hospitalized patients and 3,412 patients from other clinical settings, collected between February 9 and April 19, 2020, Mount Sinai Hospital, NYC. Limitations: Single center.
Implications: Seropositive samples pre-dated first COVID-19 detection in NYC (Feb 29, 2020). Seropositivity increased and is relatively high among Mount Sinai Hospital patients.
Figure:
Note: Adapted from Stadlbauer et al. The seroprevalence per week in ED and hospitalized patients increased to 58.1% by April 19, 2020. The seroprevalence per week of patients from other clinical settings at Mount Sinai Hospital increased to 19.3% by April 19, 2020. Used by permission from author.
- Moynan et al. The role of healthcare staff COVID-19 screening in infection prevention & controlpdf iconexternal icon. Journal of Infection. Describes a remarkably high seropositivity among healthcare workers in an Irish hospital with nosocomial COVID-19 cases.
- Solinas et al. A critical evaluation of glucocorticoids in the treatment of severe COVID-19external icon. Cytokine & Growth Factor Reviews. In-depth review of the role of glucocorticoids and dexamethasone in COVID-19 management and lists ongoing clinical trials.
- Herman et al. Evaluation of chilblains as a manifestation of the COVID-19 pandemicexternal icon. JAMA Dermatology. Refuting recent speculation of SARS-CoV-2 causing chilblains, 31 patients with chilblains did not have SARS-CoV-2 infection. Authors speculate that lifestyle changes from staying at home may instead have caused chilblains.
- Feldstein et al. Multisystem inflammatory syndrome in U.S. children and adolescentsexternal icon. NEJM. Describes 186 children with MIS-C in the US, many of whom had severe multiorgan system involvement.
- Dufort et al. Multisystem inflammatory syndrome in children in New York Stateexternal icon. NEJM. 99 cases of MIS-C in New York with description of variations in presenting symptoms and manifestations according to age.
Disclaimer: The purpose of the CDC COVID-19 Science Update is to share public health articles with public health agencies and departments for informational and educational purposes. Materials listed in this Science Update are selected to provide awareness of relevant public health literature. A material’s inclusion and the material itself provided here in full or in part, does not necessarily represent the views of the U.S. Department of Health and Human Services or the CDC, nor does it necessarily imply endorsement of methods or findings. While much of the COVID-19 literature is open access or otherwise freely available, it is the responsibility of the third-party user to determine whether any intellectual property rights govern the use of materials in this Science Update prior to use or distribution. Findings are based on research available at the time of this publication and may be subject to change.

